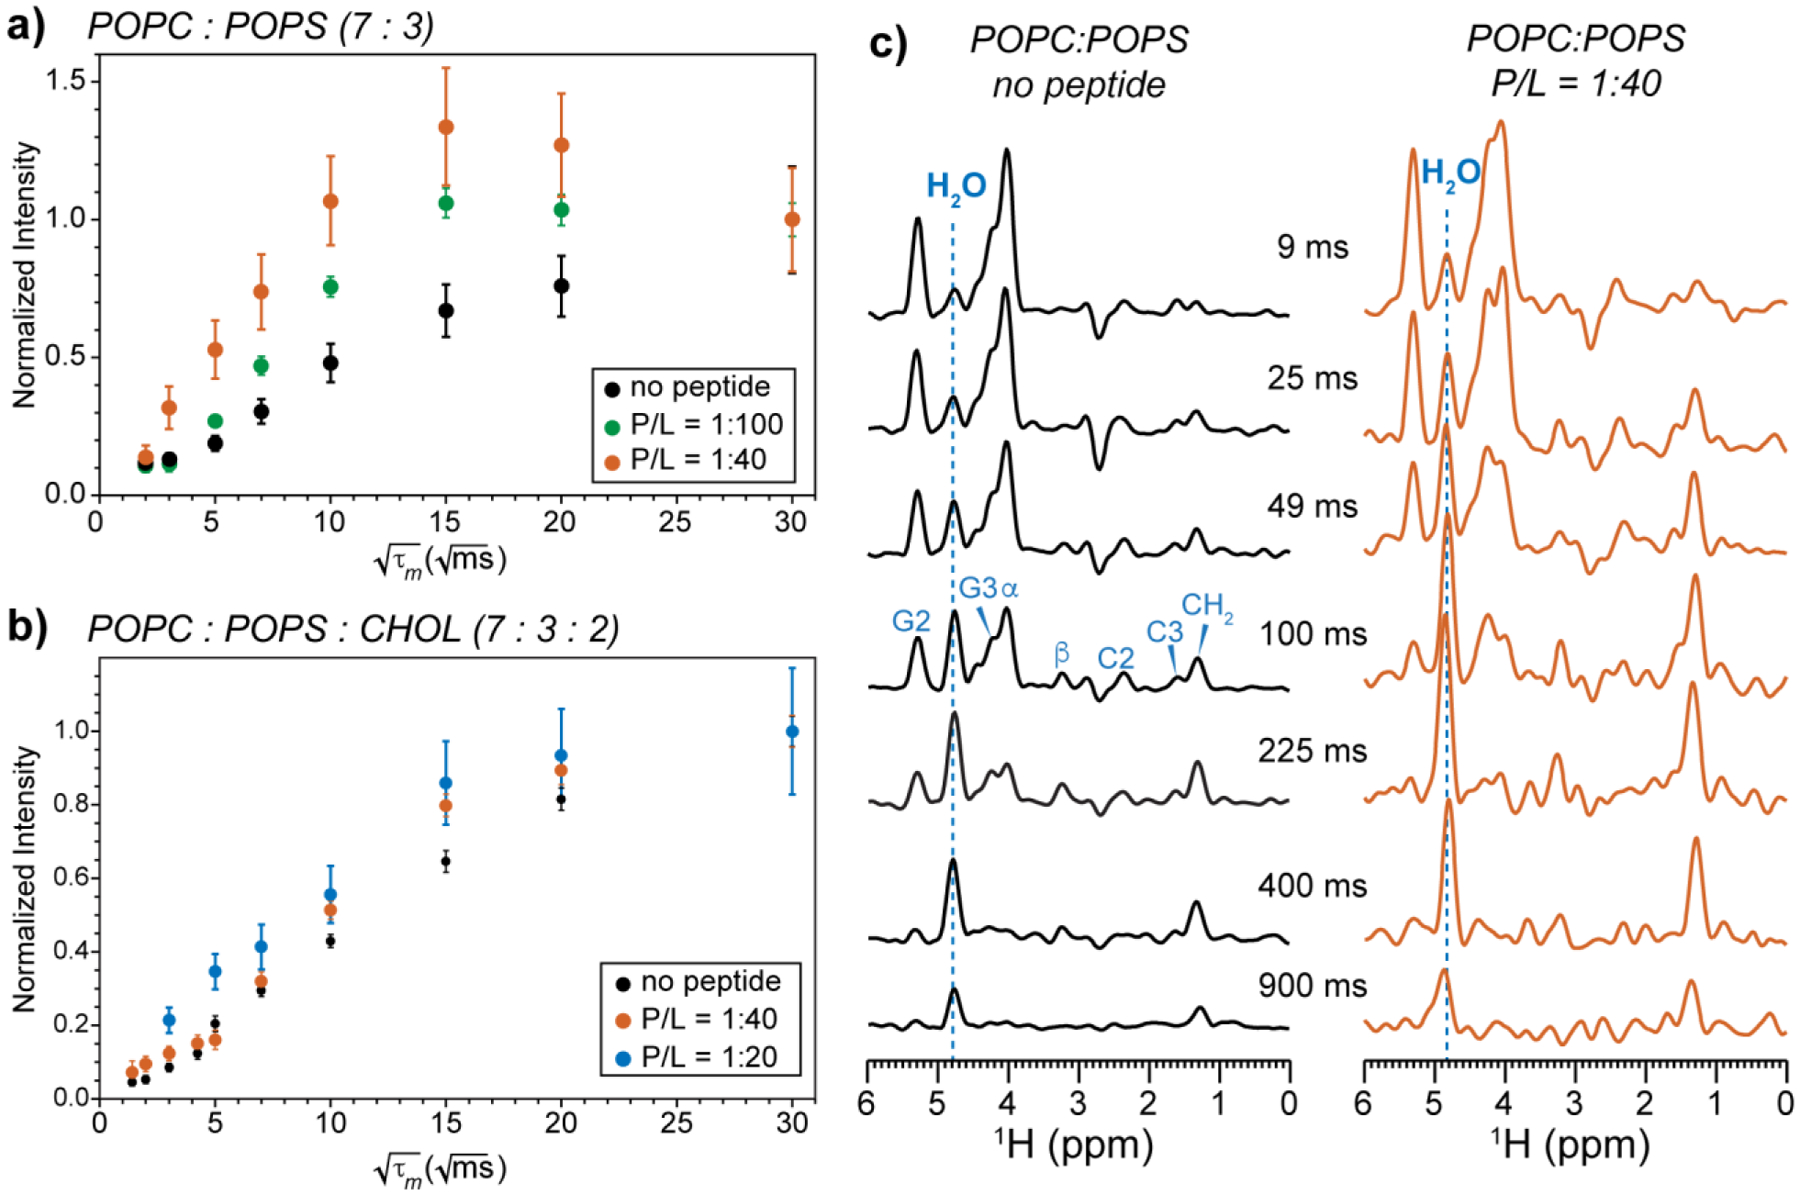
Figure 8.

Water 1H magnetization transfer to POPS in POPC : POPS membranes containing varying concentrations of peptide and cholesterol. The buildup curves were extracted from 2D 1H-31P HETCOR spectra measured as a function of mixing time. (a) Water-POPS 1H-31P cross peak intensities in the POPC : POPS (7:3) membranes without the peptide (black), with 1:100 peptide (green), and 1:40 peptide (orange). Intensities have been corrected for water 1H spin-lattice (T1) relaxation. Error bars were propagated from the experimental signal-to-noise ratios. (b) Water-POPS cross peak intensities in POPC : POPS : CHOL (7:3:2) membranes without the peptide (black) and with 1:40 peptide (orange). (c) POPS 1H cross sections extracted from the 2D spectra of the POPC : POPS membrane without the peptide and with peptide (data shown in panel a). Dashed blue lines guide the eye to the water 1H chemical shift.
