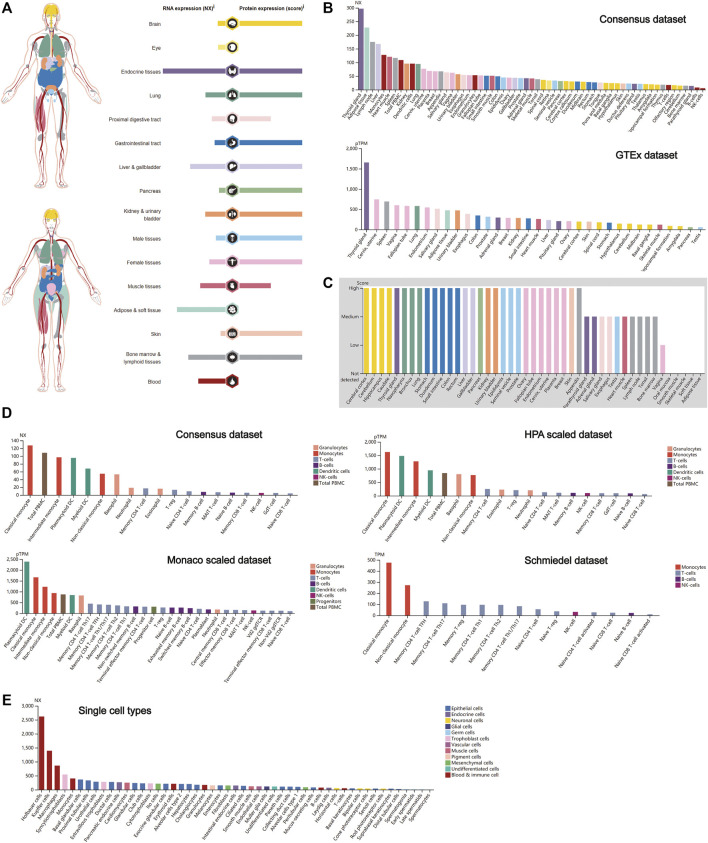
FIGURE 1.
CTSB expression in human tissues. (A) Overview of the CTSB expression and distribution in different human tissues. (B) The mRNA expression level of CTSB in human tissues which is from the Consensus data set and GTEx data set. (C) The protein expression level of CTSB in tissues based on the immunohistochemistry scores. (D) The CTSB expression level in human blood cells. (E) The CTSB expression level in single cell types.

