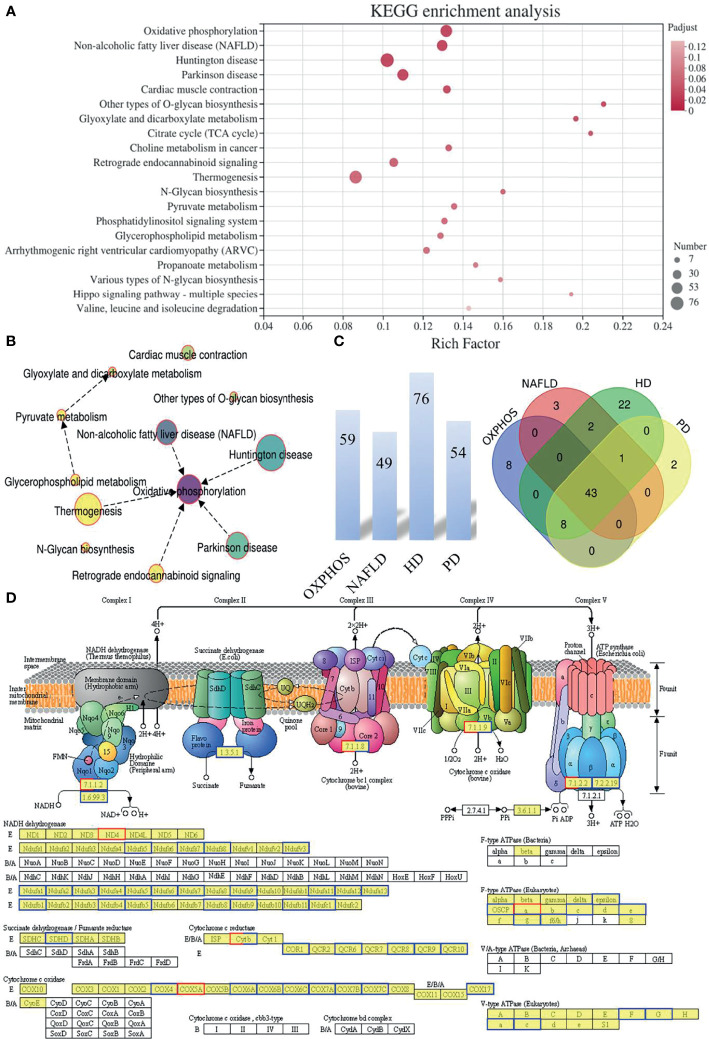
Figure 2.
The functional pattern of gene expression between IVO and IVM groups. (A) The top 20 enriched KEGG pathways for the DEGs identified between the IVO and IVM groups. The X-axis represents the Rich Factor while the Y-axis represents the names of the pathways. The higher the Rich factor, the higher the degree of enrichment. (B) Network chart showing the significantly enriched KEGG pathways. (C) The number above each bar indicates the enriched DEGs of the top four terms (the OXPHOS, NAFLD, HD, and PD pathways) and the Venn diagram shows the overlapping DEGs between the top four enriched KEGG pathways. (D) KEGG pathway diagram for oxidative phosphorylation. Boxes with red borders represent up-regulated genes while boxes with blue borders represent down-regulated genes when the IVO group was compared with the IVM group.

