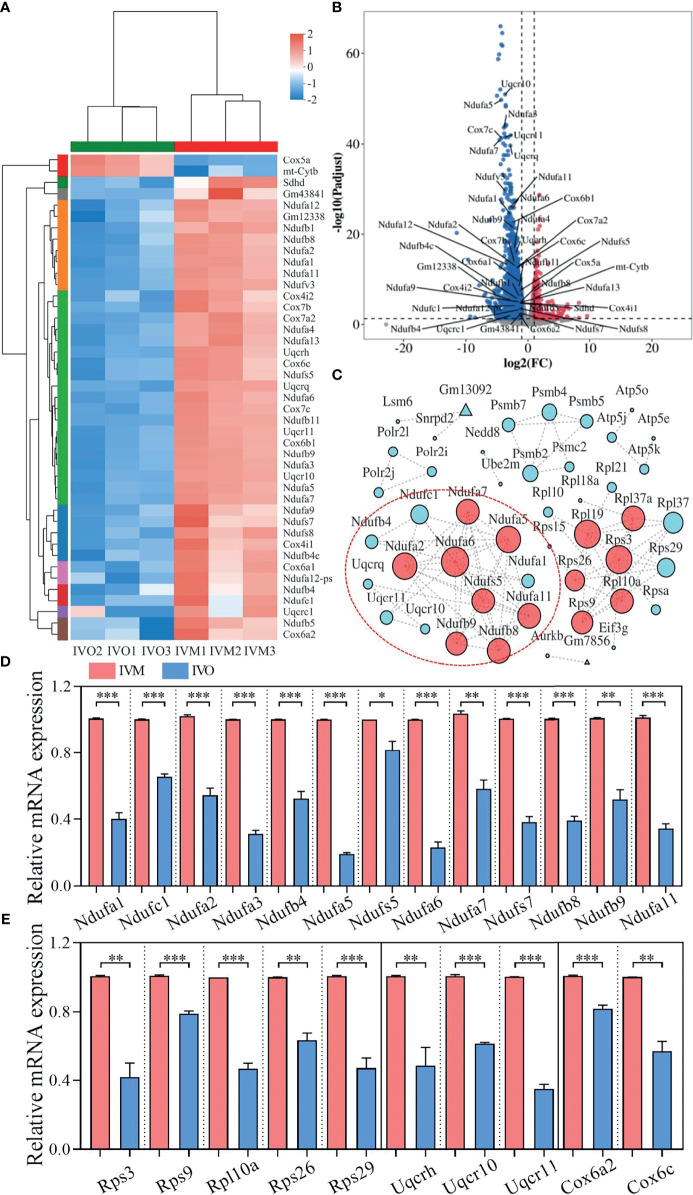
Figure 3.
DEG analysis and network patterns for the top four enriched KEGG pathways. (A) Heatmap diagram showing the top four enriched KEGG pathways with overlapping DEGs (P-adjusted < 0.05 and |log2FC| ≥ 1). (B) Volcano plots showing overlapping DEGs in the top four KEGG enrichment analyses. Blue dots indicate down-regulated genes while red dots indicate up-regulated genes. (C) A PPI network for the down-regulated genes was constructed using the STRING database to compare the IVO and IVM groups. The node size represents the number of linked lines and connectivity. (D, E) The relative mRNA levels of DEGs including NADH-ubiquinone oxidoreductase (complex I) subunits, the ribosomal protein family, ubiquinol-cytochrome c reductase subunits, and cytochrome c oxidase subunits between the IVM and IVO groups, as determined by RNA-seq and confirmed by qRT-PCR assay. Data represent the mean ± SEM of three independent experiments. *P < 0.05, **P < 0.01, and ***P < 0.001.

