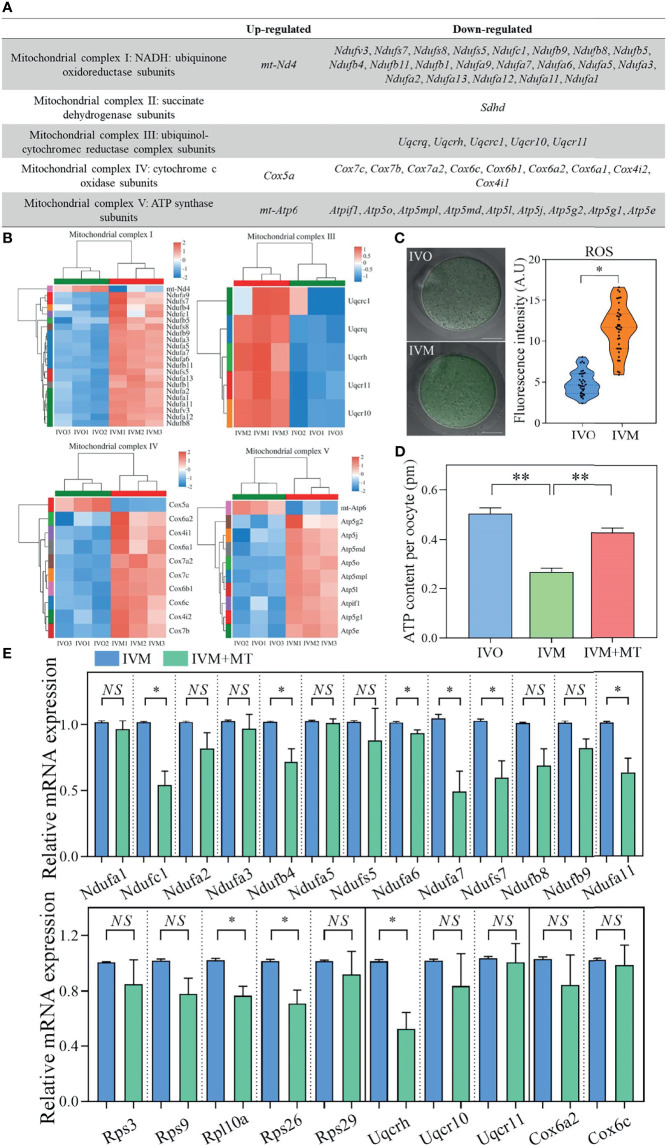
Figure 4.
(A) List of up- and down-regulated genes in the OXPHOS system of five respiratory chain complexes in the mitochondria when compared between IVO and IVM groups. (B) Heatmaps corresponding to the identified DEGs. The red rows represent high expression levels and the blue rows represent low expression levels. Each column represents an independent sample. (C) Representative images of ROS signals in IVO and IVM groups. Scale bars = 20 μm. The fluorescence intensity of ROS in IVO and IVM groups. (D) Graphs showing the ATP levels in IVO, IVM, and melatonin-treated IVM oocytes (n = 20 for each group). (E) The relative mRNA levels of target genes including NADH-ubiquinone oxidoreductase (complex I) subunits, the ribosomal protein family, ubiquinol-cytochrome c reductase subunits, and cytochrome c oxidase subunits between the IVM and melatonin-treated IVM oocytes. Data represent the mean ± SEM of three independent experiments. NS, not significant, *P < 0.05, and **P < 0.01.

