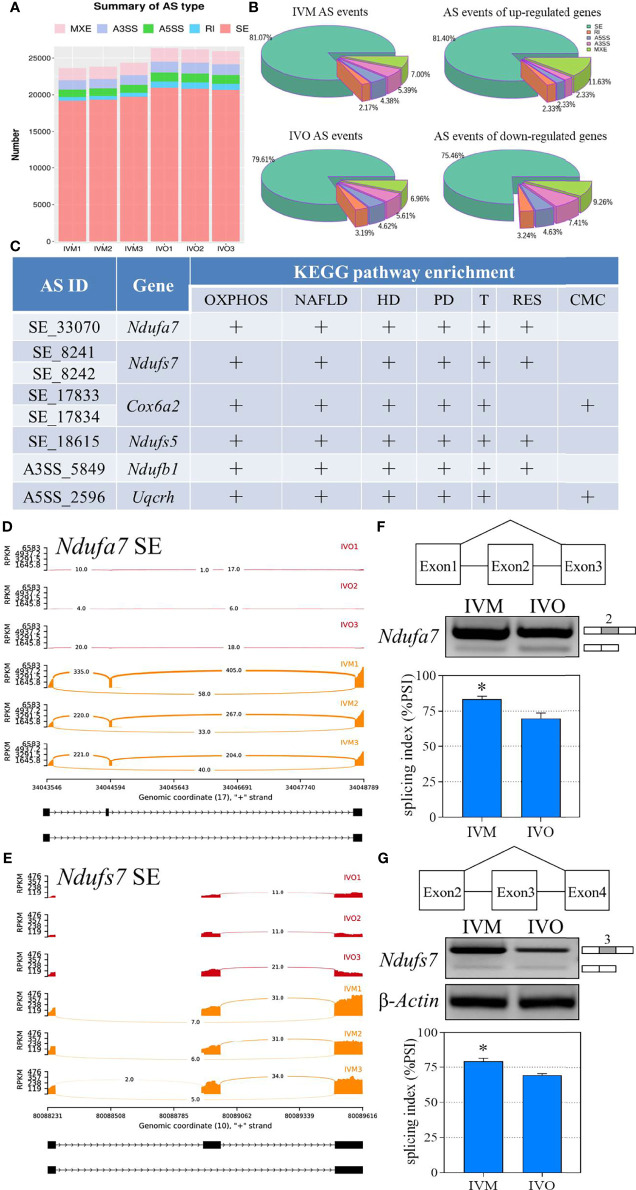
Figure 5.
Statistical analysis of the AS events for KEGG enrichment terms. (A) A comparison of the number of AS events between the IVO and IVM groups. (B) The proportion of AS events of the IVM group, IVO group, the up-regulated and down-regulated genes. (C) List of significantly different AS events for the top four KEGG enriched overlapping DEGs (OXPHOS, oxidative phosphorylation; NAFLD, non-alcoholic fatty liver disease; HD, Huntington disease; PD, Parkinson disease; T, Thermogenesis; RES, retrograde endocannabinoid signaling; CMC, cardiac muscle contraction. Sashimi plots depicting the visualize specific splice sites of splicing events for exon skipping of the Ndufa7 (D) and Ndufs7 (E) genes. The red plots represent the IVO group while the orange plots represent the IVM group. The distribution of the number of junction reads is shown for each sample. The schematic in the upper panels represent the different splicing pattern. Representative agarose gels of semi-quantitative RT-PCR for Ndufa7 exon 2 (F) and Ndufs7 exon 3 (G) are shown in the middle panels. β-Actin served as an internal control. The histogram in the lower panel shows the average PSI that the IVO oocytes present exon inclusion suppressed compared with the IVM oocytes. Data represent the mean ± SEM of three independent experiments. *P < 0.05.

