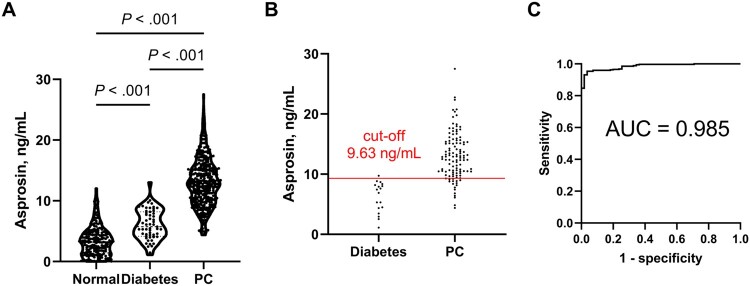
Figure 3.
Discrimination between pancreatic cancer (PC) and diabetes patients with serum asprosin concentration. A) Violin plot was drawn for serum asprosin levels in normal, diabetic, and PC patients (normal, n = 199; diabetic, n = 55; PC, n = 347); 2 -sided Welch’s t test was used. Violin plots are presented with the median and quartiles. B) Discrimination of normal (n = 18) and PC (n = 115) groups in the validation set with the cut-off value (9.63 ng/mL) from an independent training set was performed using the shortest Euclidean distance method in the receiver operating characteristic (ROC) curve. C) ROC curve was obtained for the combination of serum asprosin and CA19-9 in diabetes vs PC comparison. Logistic regression was used for asprosin and CA19-9 as continuous variables. The resulting probability variable was used to construct the ROC curve.

