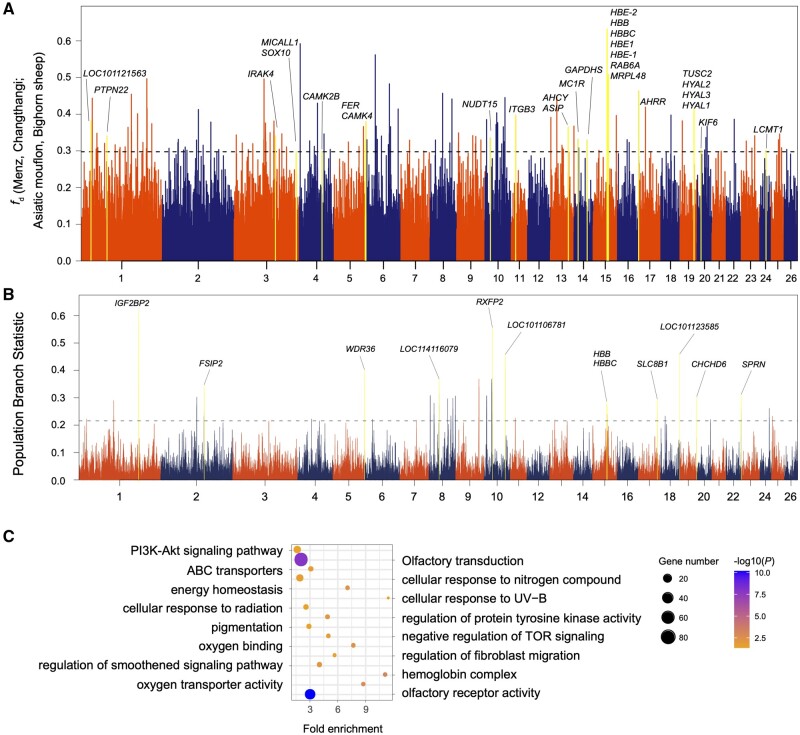
Fig. 5.
Signals of introgression and selection in the Changthangi sheep. (A) Manhattan plot showing the introgression signal from Asiatic mouflon to Changthangi sheep. The locations of the HBB, HBE2, HBBC, HBE1, RAB6A, and MRPL48 genes are shown by the highest fd value. (B) Signals of selection in the Changthangi sheep detected by the PBS (Yi et al. 2010). PBS values in windows of 100 kb and names of genes associated with the highest peaks are shown. (C) GO and KEGG pathway enrichment analysis based on genes across significant introgressed regions from wild species to Changthangi sheep. The dot size shows the gene count enriched in the pathway, and the dot color shows adjusted significance value of the enriched pathways.

