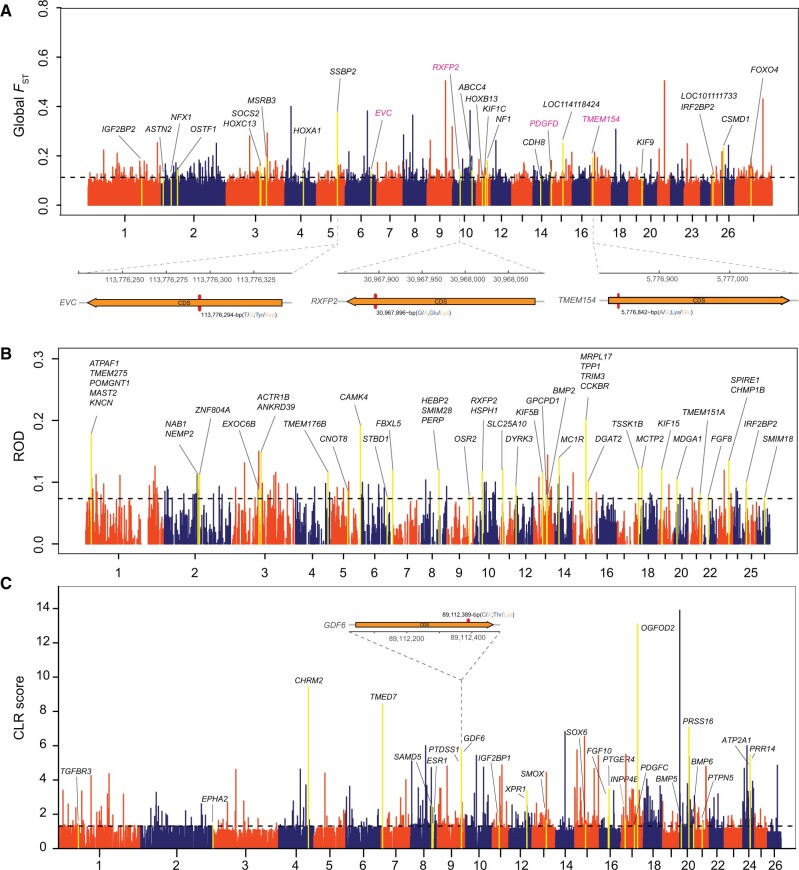
Fig. 6.
Genome-wide selective signals across all the domestic sheep populations based on global FST and ROD, and associated with the stature (i.e., body size) phenotype. (A) Genome-wide distribution of global FST across all the 158 domestic sheep populations. (B) Candidate selective genomic regions based on ROD analysis. (C) Manhattan plot for the dwarf (i.e., small body size) phenotype showing the CLR score distribution in the Ouessant sheep population. Genes within regions with significant outlier scores are highlighted.

