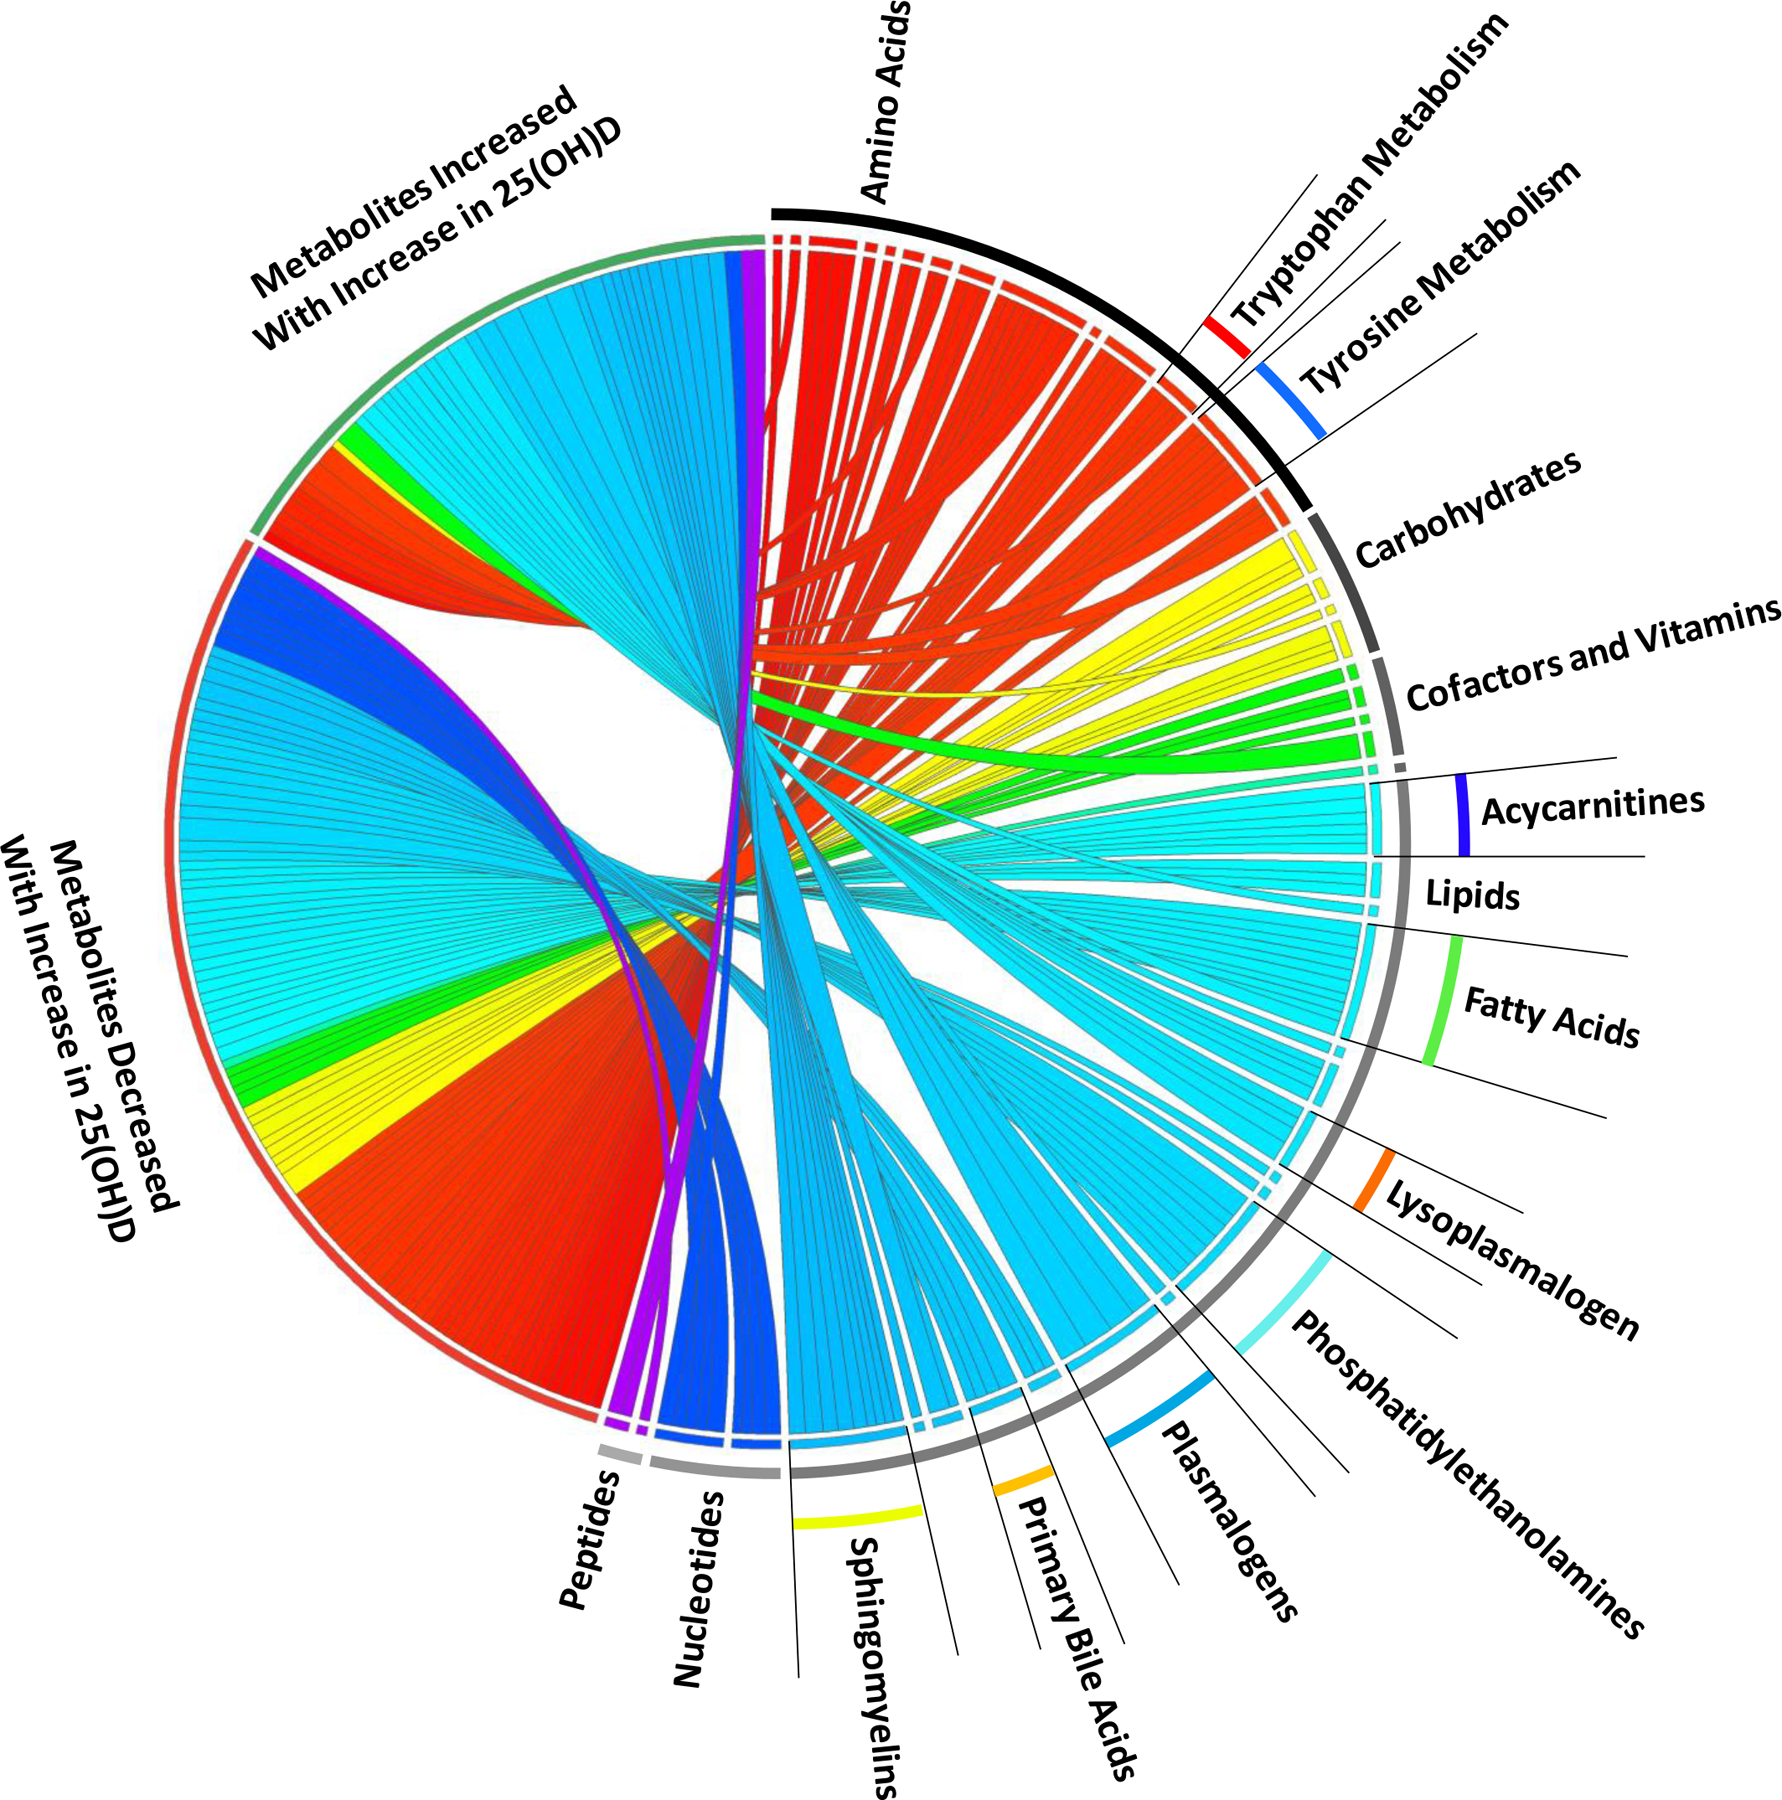
Figure 1.

Circos plot of plasma metabolites by absolute increase in 25(OH)D levels. Bipartite graph illustrating mixed-effects linear regression results of metabolites with significantly changes (increased or decreased) over day 0, 3 and 7 with an absolute increase in 25(OH)D levels between day 0 and day 3. Graph connects metabolic response to an absolute increase in 25(OH)D levels with the individual metabolites grouped by metabolite Super Pathway (e.g. lipid) and Sub Pathway (e.g. sphingomyelin). Width of curves indicates strength of the significance (−log10(p) value) with wider curves having greater significance. All metabolites shown are significant at the −log10(p) > 4.06, p < 8.65 × 10⁻⁵ level.
