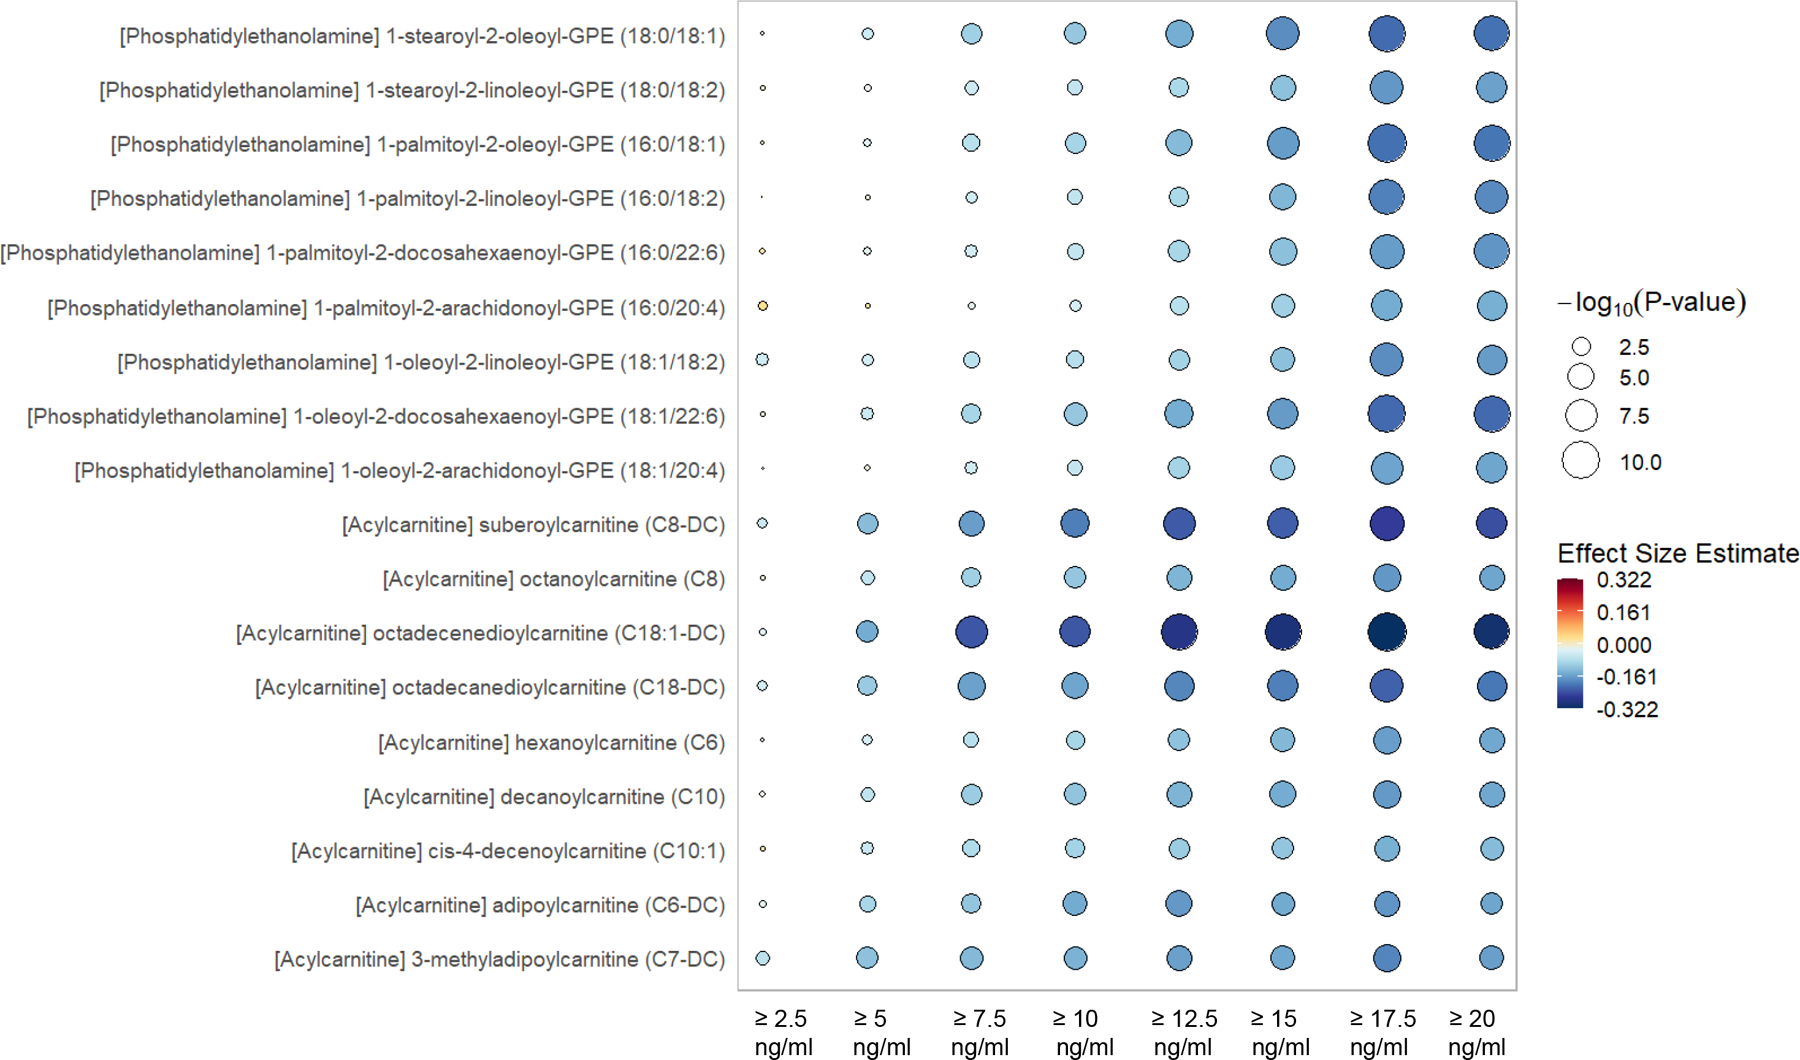
Figure 3.

Rain plot of decreasing metabolites by incremental absolute increase in 25(OH)D following intervention. The rain plot shows the directionality and magnitude of estimates of the association between individual metabolites and the absolute increase of plasma 25(OH)D between day 0 and day 3 to levels of ≥ 2.5, 5.0, 7.5, 10.0, 12.5, 15.0, 17.5 or 20.0 ng/ml. Results are focused on acylcarnitines and phosphatidylethanolamines. The color fill scale of individual rain plots indicates the effect size - increased (dark red) or decreased (dark blue) of the individual metabolite following mixed-effects linear regression. The size of the individual rain ‘droplet’ indicates strength of the significance (−log10(p) value) with larger plots having greater significance. Metabolites shown are considered significant at the −log10(p) > 4.06, p < 8.65 × 10⁻⁵ level.
