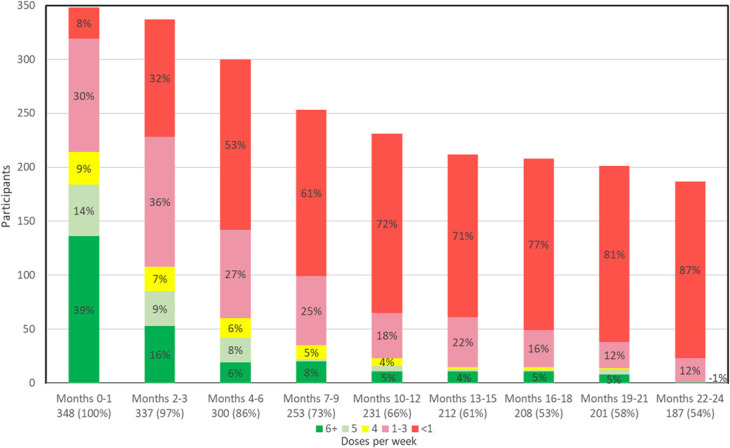
FIGURE 1.

PrEP adherence over time. Each column indicates the number of participants picking up PrEP at each study visit (ie, pharmacy refill adherence) from months 0 through 21. Electronically monitored adherence over the period covered by each pharmacy refill is shown as the average number of doses per week. The green color indicates high adherence (5+ doses/week).
