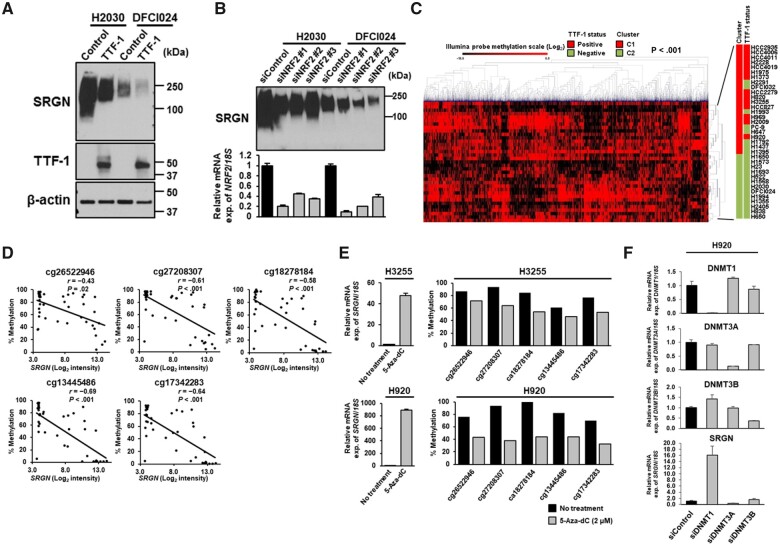
Figure 5.
Regulation of Serglycin (SRGN) gene expression by DNA methylation. Immunoblot analyses of SRGN expression in the conditioned media from H2030 and DFCI024 cell lines A) after TTF-1 overexpression and B) treated with negative control siRNA or NRF2 siRNA. Experiments have been performed with at least 3 independent biological repeats. C) Hierarchical clustering analysis of the top 15% methylated CpG sites (n = 4137) of an Illumina Infinium HumanMethylation27 BeadChip microarray in 35 LUAD cell lines. P values were calculated using Fisher’s exact test. C1 and C2, clusters 1 and 2. D) Correlation of SRGN mRNA expression and the methylation levels of the 5 CpG sites in the SRGN promoter region in 41 LUAD cell lines. Correlation coefficients and P values were calculated using Spearman correlation test. To adjust P values for multiple comparisons, the Bonferroni correction was conducted. E) Quantitative reverse transcription polymerase chain reaction (RT-PCR) analysis of SRGN mRNA expression levels (left) and the methylation levels of the 5 CpG sites in the SRGN promoter region (right) after treatment with 5-Aza-dC at 2 µM in H3255 and H920 cell lines. F) Quantitative RT-PCR analysis of DNA methyltransferase 1 (DNMT1), DNMT3A, DNMT3B, and SRGN mRNA expression levels in H920 cells treated with negative control siRNA or siRNA against DNMT1, DNMT3A, or DNMT3B. In E and F, experiments have been performed with at least 3 independent biological repeats. mRNA expression was presented as the average and SD of triplicate samples from a representative experiment. All statistical tests were 2-sided.

