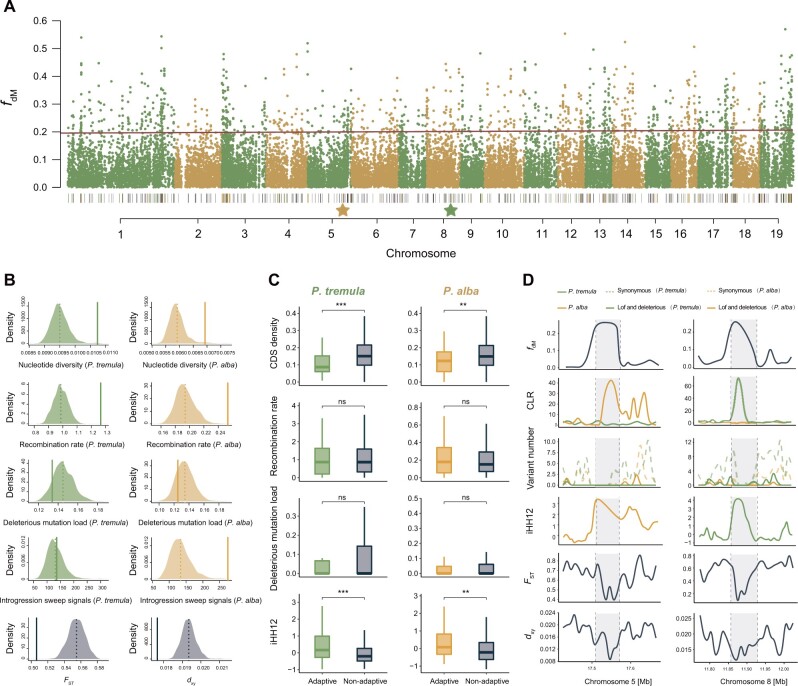
Fig. 5.
Genomic characteristics of the putative introgressed regions between Populus tremula and P. alba. (A) Manhattan plot showing the fdM values across genome. The black bars on bottom indicate the locations of the candidate introgressed regions. The yellow and green bars represent the adaptive introgressed regions in P. alba and P. tremula, respectively. The location of the two stars corresponds to the adaptive introgressed region shown in (D). (B) Assessing genomic features and patterns of selection acting on candidate introgressed regions. Diagram showing the comparison of nucleotide diversity (π), recombination rate, deleterious mutation load, introgression sweep signals, and genetic divergence (FST and dxy) between introgressed regions (solid line) and the distribution resulting from the 1,000 randomizations (dashed line: average across randomizations) for P. tremula and P. alba, respectively. (C) Comparison of coding density, recombination rate, deleterious mutation load, and iHH12 statistics between adaptive and nonadaptive introgressed regions in P. tremula and P. alba, respectively. Significance between adaptive and nonadaptive introgressed regions within each species was evaluated using Mann–Whitney tests and the significance is indicated by asterisks above the boxplot: ***P < 0.001, **P < 0.01, *P < 0.05, nsP > 0.05. (D) Magnification of fdM, CLR, number for deleterious and synonymous variants, iHH12 statistic, FST, and dxy across an adaptive introgression region (gray shading) specifically to P. alba and P. tremula along chromosomes 5 and 8. Genomic characteristics of the putative introgressed regions for the other nine species pairs can be found on supplementary figure S24, Supplementary Material online.

