Fig. 2.
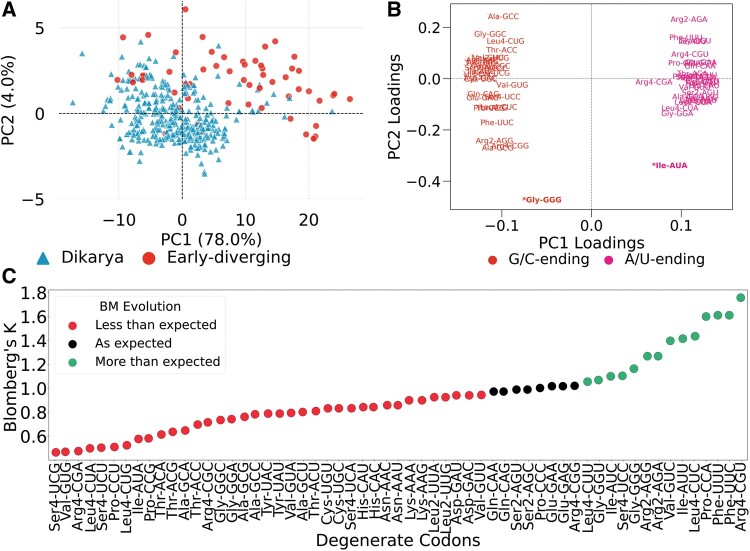
Phylogenetic analysis of genome-wide codon usage frequencies. (A) PCA on RSCU matrix separates species into the dikarya and early-diverging sub-kingdoms, primarily along the axis of the second principal component (PC2). Each dot is a species whose color and shape represent the sub-kingdom. (B) Loadings plot showing the correlation between codons and the first two principal components. Codons are colored based on the G/C or A/U composition at the third base. A/U- and G/U-ending codons equally but inversely contribute to the PC1 scores. On the other hand, PC2 scores are differently influenced by codons, with the most influential being the rare codons, GGGGly and AUAIle (see also supplementary fig. S1D, Supplementary Material online). (C) Stripplot showing the variation in the phylogenetic signal of the usage of degenerate codons. A total of 51/59 codons reported Blomberg’s K not equal to 1 suggesting they evolved at a rate less than or greater than expected by genetic drift as modeled by Brownian motion. All P values are statistically significant (<0.05).

