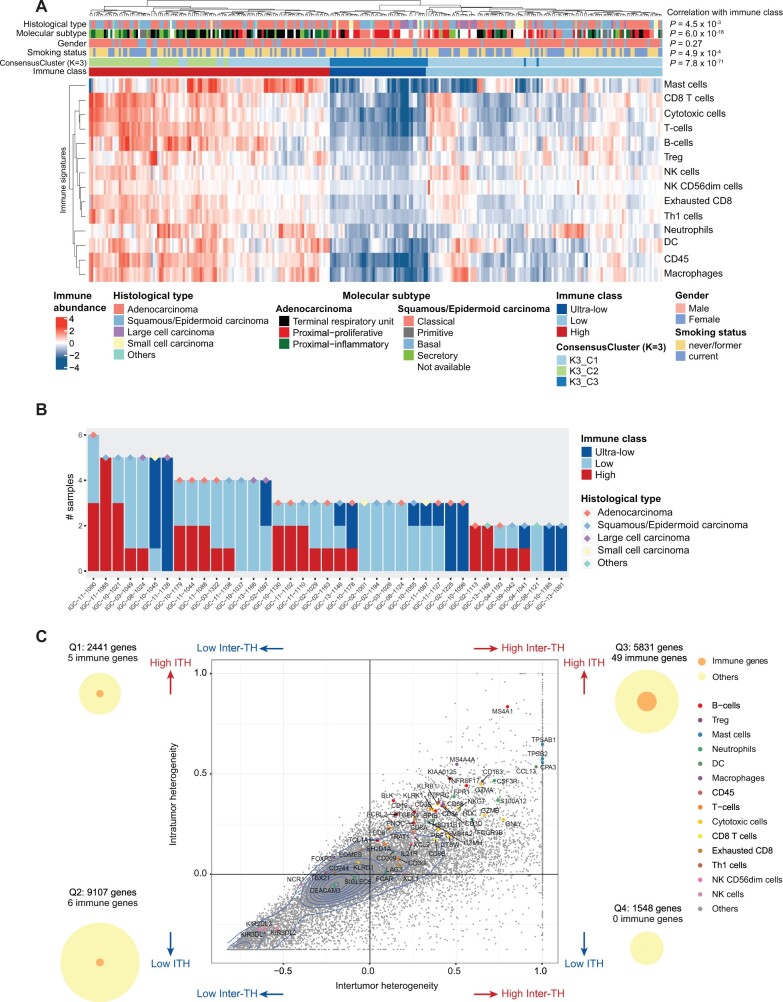
Figure 1.
Summary of inter-tumor heterogeneity (inter-TH) and intra-tumor heterogeneity (ITH) of EAGLE-lung samples. A) Unsupervised clustering of RNA-based abundance of 14 immune cells across 269 tumor samples from 160 tumors. Histological types, molecular subtypes, sex, smoking status, consensus clusters (cluster count K = 3), and immune classes are indicated by different colors of the column sidebars. The P values are based on the χ2 test of the immune classes and clinical features. B) Summary of immune classes of samples from the same subjects. 39 subjects with at least 2 samples per subject that passed the purity filtering were analyzed. Histological types of subjects are indicated by different colors of the diamond symbols. C) Inter- and intratumor mRNA heterogeneity quadrant of 18 927 expressed genes in 132 samples from 39 multiregion tumors. Each dot represents a gene. Genes of immune signatures are indicated by colors. 2D density contour is indicated by blue lines. The plot is split into 4 quadrants by average inter-TH and ITH, defined as Q1 to Q4, respectively (ie, x- and y-axes indicate mean values of ITH and inter-TH scores, respectively). The numbers of all genes and immune genes are indicated by circles on the left and right sides of the figure. All statistical tests were 2-sided. DC = dendritic cells; NK = natural killer; Treg = regulatory T cells.

