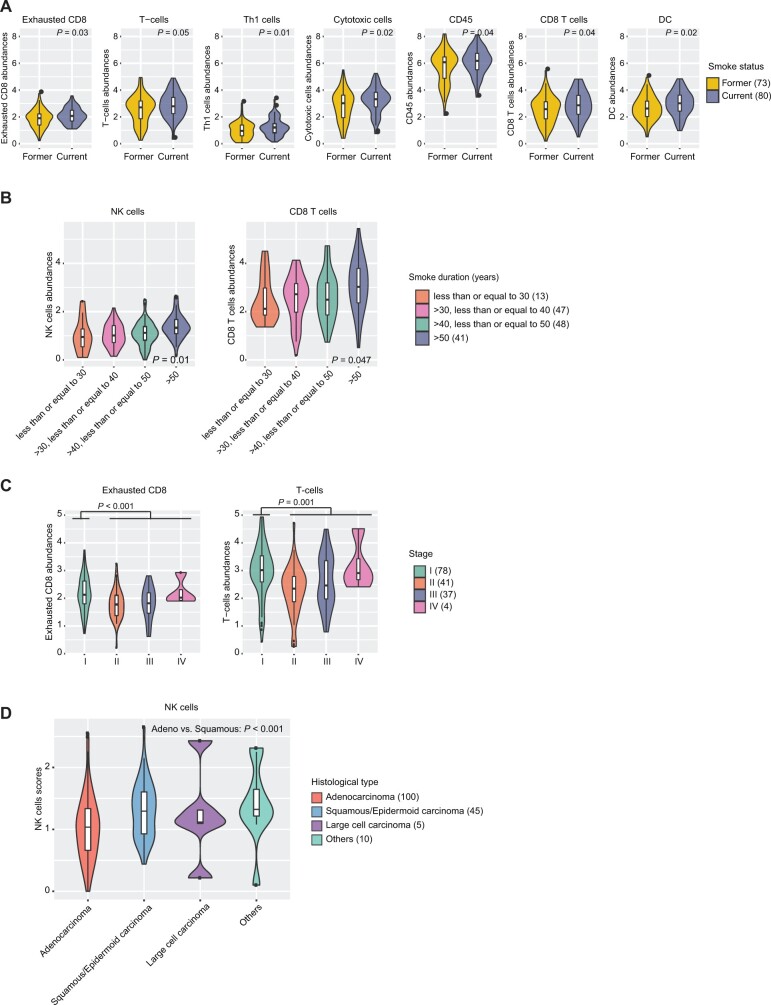
Figure 2.
Association of immune cell abundances with clinical and pathological features. A) Comparison of 8 immune cell abundances in former (n = 73) and current smokers (n = 80). The immune cell abundances were determined by the average expression level across all marker genes for each immune cell type and were plotted in the same scale across all figures in the panel. The nominal P value is based on a 2-sided Student t-test. B) Distribution of the natural kill (NK) cell and CD8 T-cell abundances in patients with different smoke duration periods. P values are based on ordinal regression adjusted for smoking status. C) Comparison of 5 immune cell abundance in subjects with different tumor stages. P values are based on a 2-sided Student t-test comparing the stage I patients vs stage II-IV patients. D) Comparison of NK cell abundance in different histological types. The P value is based on a 2-sided Student t-test of adenocarcinoma (n = 100) and squamous and/or epidermoid carcinoma (n = 45). DC = dendritic cell.

