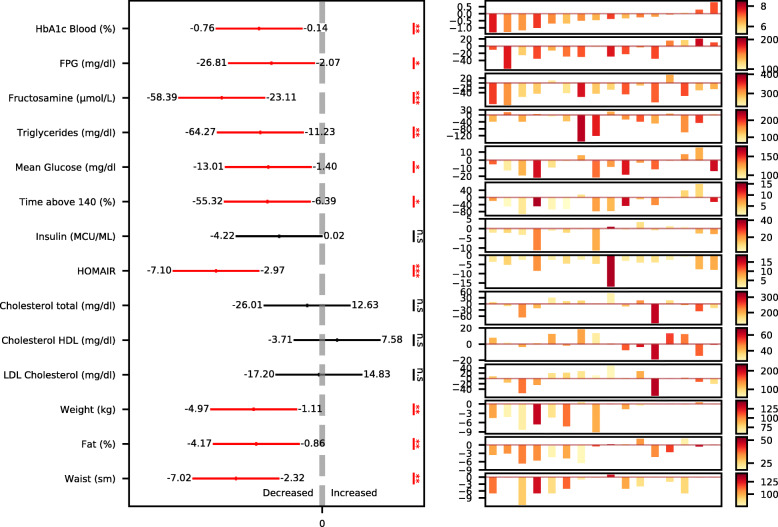
Fig. 4.
A PPT diet improves metabolic outcomes after 6 months. Illustration of changes in multiple metabolic outcomes across all participants and per participant. Left: changes in the outcomes across all participants (n = 16), presented as the 95% confidence interval (CI) of the change in outcomes at 6 months time point vs. baseline. Statistical significance is marked (one-sample t-test for all parameters except for HOMA-IR, which we used the Mann-Whitney U test, ***p < 0.001, **p < 0.01, *p < 0.05; n.s, not significant). Right: changes in the outcomes per participant, presented with a waterfall-like scheme, where each bar represents a participant. The color scale refers to bars, indicating the level of baseline value of each outcome for each participant. Participants are sorted by the 6-month change in HbA1c

