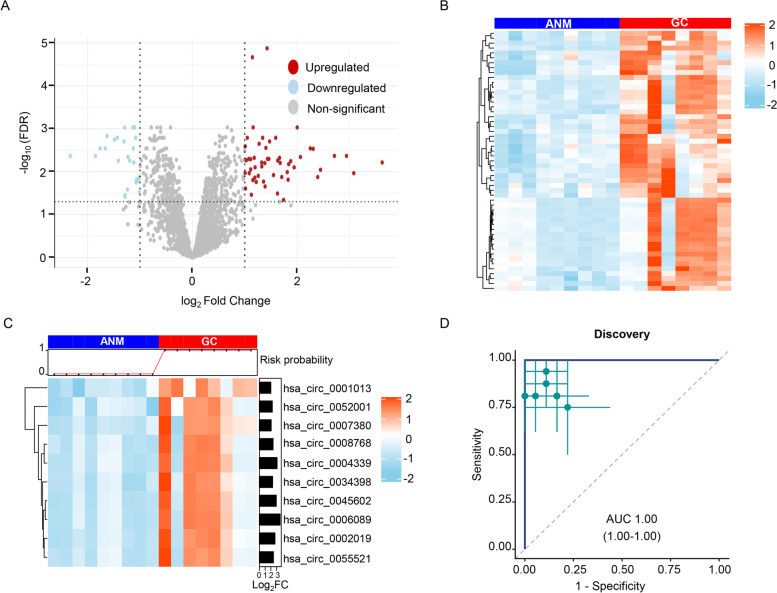
Fig. 1.
Genome-wide discovery of circRNA candidates for the diagnosis of patients with GC by analyzing transcriptomic expression profiling datasets. A Volcano plot illustrates the significantly up- (red) and down-regulated (blue) circRNAs based on log2FC > 1 and adjusted p < 0.05 derived from the GSE89143 and GSE83521 datasets. B Heatmap of upregulated circRNAs between GC patients and matched adjacent normal mucosa (ANM). C Heatmap of 10 circRNA candidates based on their log2FC > 2 and adjusted p < 0.05 between GC patients and adjacent normal mucosa. D Assessment of performance of 10 circRNA based biomarker panel by receiver operating characteristic (ROC) curve analysis. ROC curves are shown with 95% confidence intervals (Cis). Green lines in right panel indicate 95% CIs of sensitivity and specificity for each circRNA; green points, optimal threshold for sensitivity and specificity

