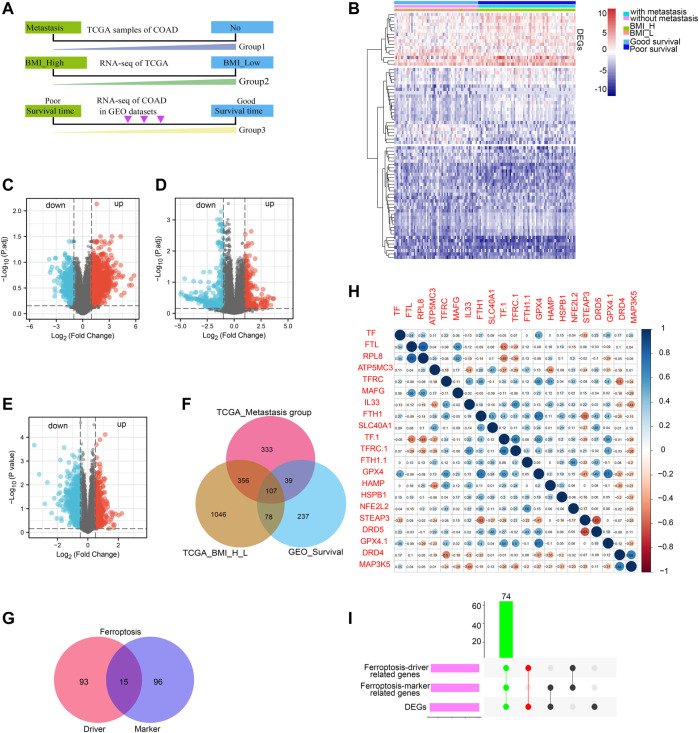
FIGURE 1.
Screening of ferroptosis-related DEGs. Work flow of screening based on TCGA COAD metastasis, BMI value and survival status of GEO COAD patients, respectively (A); heat map of DEGs based on TCGA COAD metastasis, BMI value and survival status of GEO COAD patients (B), different bars indicated different group; Volcanic map of DEGs, red represents upregulated genes while blue represents downregulated genes (C–E); Venn diagram showing upregulated overlapping DEGs based on TCGA COAD metastasis, BMI value and survival status of GEO COAD patients, respectively (F). Ferroptosis-driver and -marker genes were shown with venn diagram from FerrDb database (G); Ferroptosis-driver genes were 108; Ferroptosis-marker genes were 111; the intersected genes co-expressed between ferroptosis-driver and -marker genes were 15; The correlation between DEGs and ferroptosis-related genes was shown with representative correlation plot (H); Blue bar indicated: R (sperman’s coefficient) > 0; red bar indicated: R (sperman’s coefficient) < 0; The DEGs correlated positively with ferroptosis-driver and -marker genes were presented with UpsetR diagram (I); green bar indicated the final ferroptosis-related genes.

