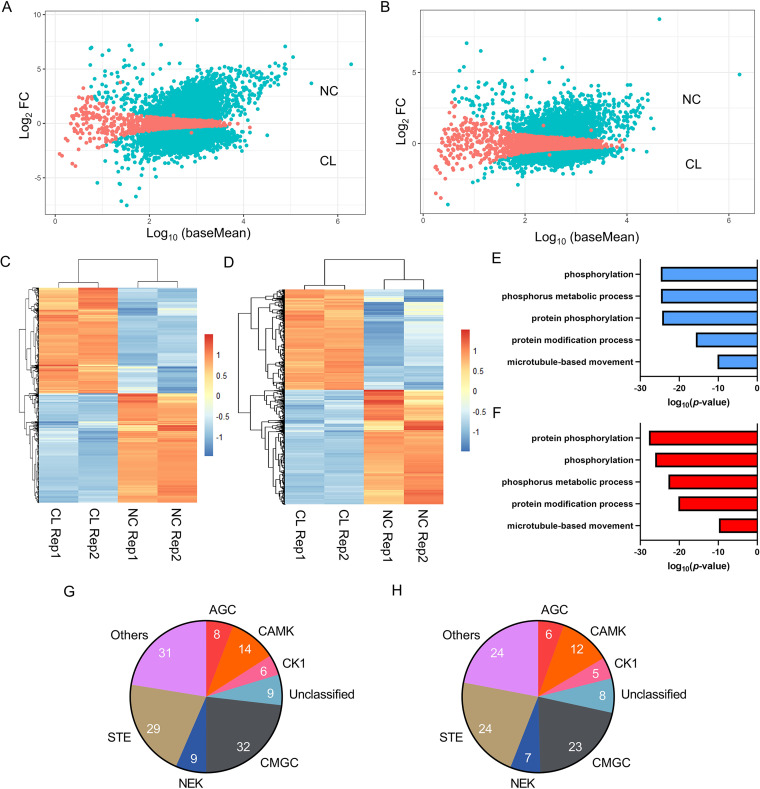
FIG 5.
Differential gene expression analysis of RNA-seq data sets in L. mexicana. Scatterplot of mean of normalized read counts in log-scale (log10 baseMean) versus log2-fold change (log2 FC) for NC versus CL samples of axenic amastigotes (A) and promastigotes (B) with statistically significant hits (Padj < 0.05) shown in blue. Heatmaps of the significant (Padj<0.05) DESeq2 normalized read counts of RNA-seq NC and CL replicates of axenic amastigotes (C) and promastigotes (D). Top five BP GO-Terms overrepresented in the differentially expressed (Padj cutoff < 0.01) CL data sets of axenic amastigotes (E), and promastigotes (F), respectively. Classification of the protein kinases according to their catalytic domain types in axenic amastigotes (G), and promastigotes (H), respectively.

