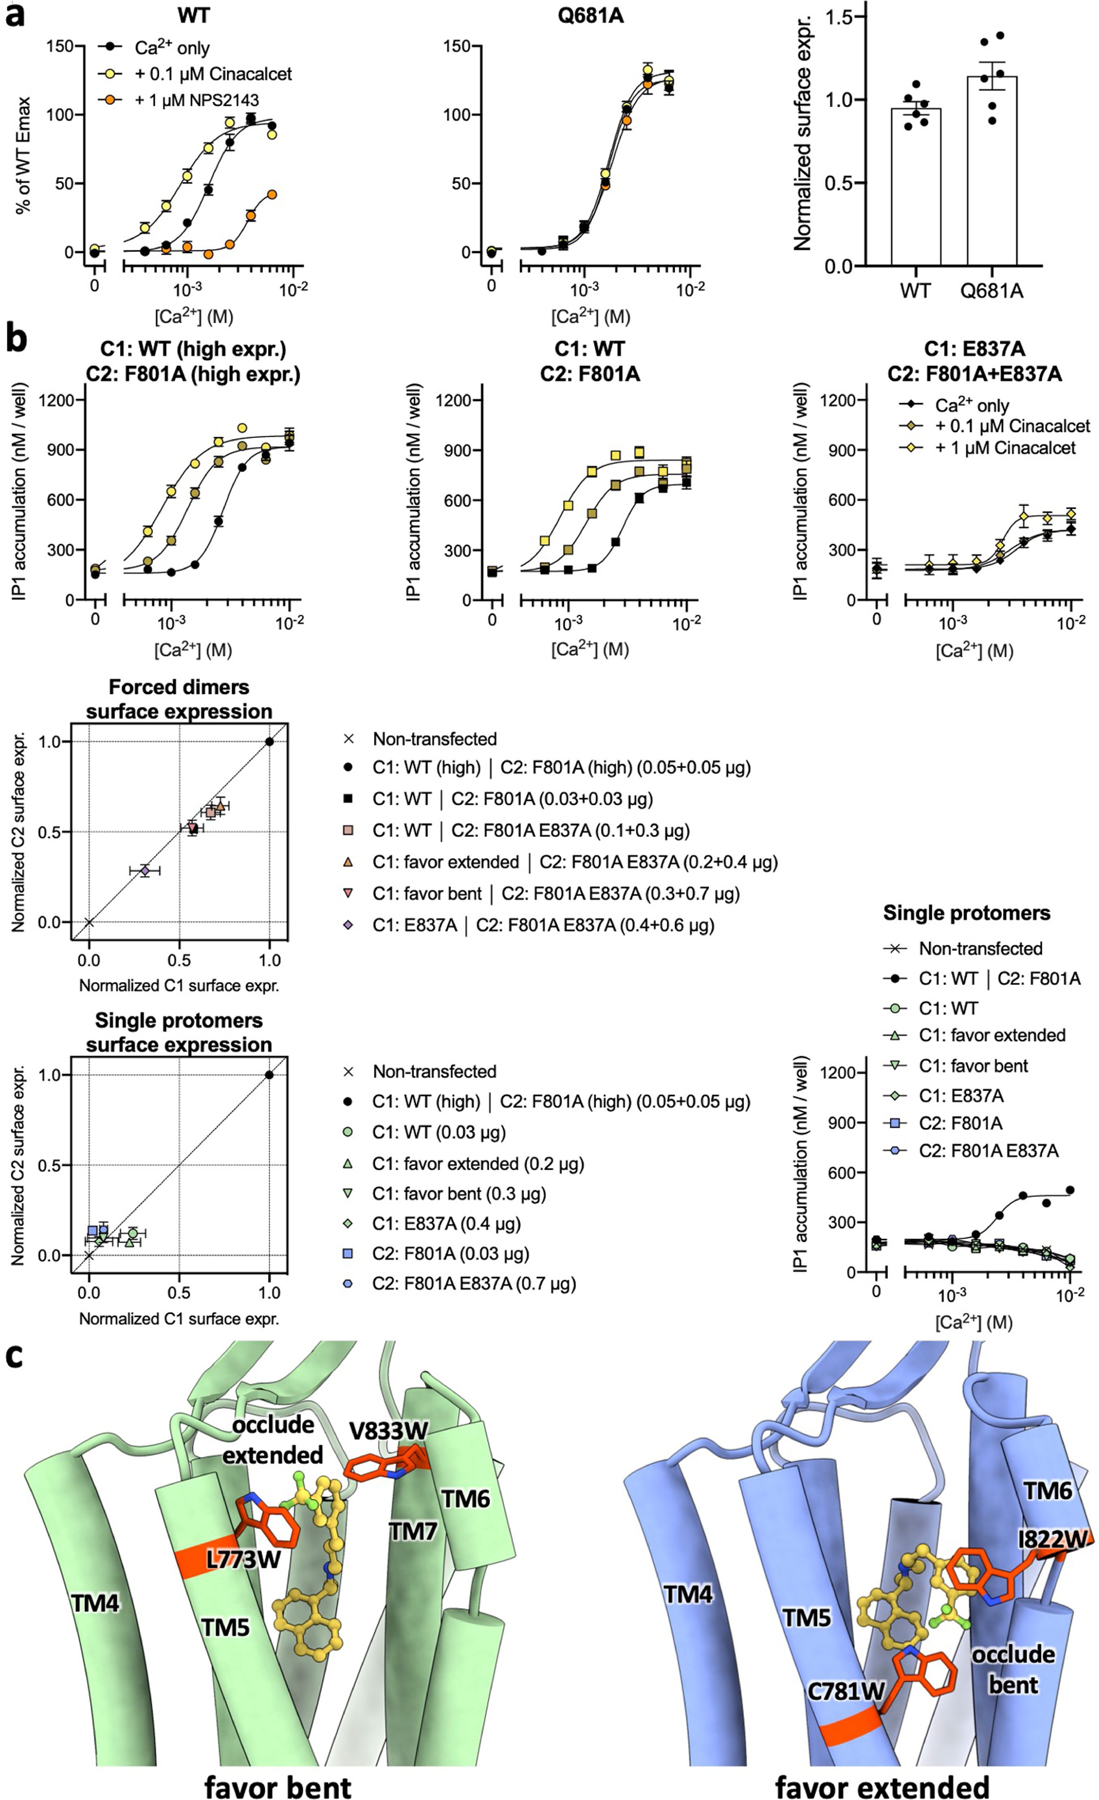
Extended Data Fig. 8 |. Cell surface expression levels and calcium response curves of various CaSR constructs.

a, Ca2+ response curves (left and middle panels) of the wild-type or Q6813.33A mutant CaSR expressed at similar levels (plasma membrane expression levels shown on the right panel) in HEK293 cells in the absence or presence of the PAM cinacalcet or NAM NPS-2143 as monitored by IP1 accumulation assays. Data represent mean ± s.e.m. from six independent experiments each performed in duplicate. b, Top three panels depict results from IP1 accumulation assays monitoring the Ca2+ responses of the CaSR heterodimer without or with the PAM-binding deficient mutant E837A in both protomers. Middle and bottom left panels show results from cell surface ELISA assays verifying the different C1 and C2 construct combinations yield similar expression levels of CaSR heterodimer at the plasma membrane. Bottom right panel shows the transfection with only one protomer containing either a C1 or C2 tail results in no IP1 accumulation signals in response to stimulation with Ca2+. Functional IP1 data represent mean ± s.e.m. from 5 independent experiments (top row) or 3 independent experiments (3rd row) each performed in duplicate, whereas cell surface ELISA data represent mean ± s.e.m. from 3 independent experiments performed in triplicate. c, Structural illustrations of how the introduced mutations would occlude extended or bent PAM conformations.
