
Extended Data Fig. 4 |. Cryo-EM maps and FSC curves of NAM-bound CaSR complexes.
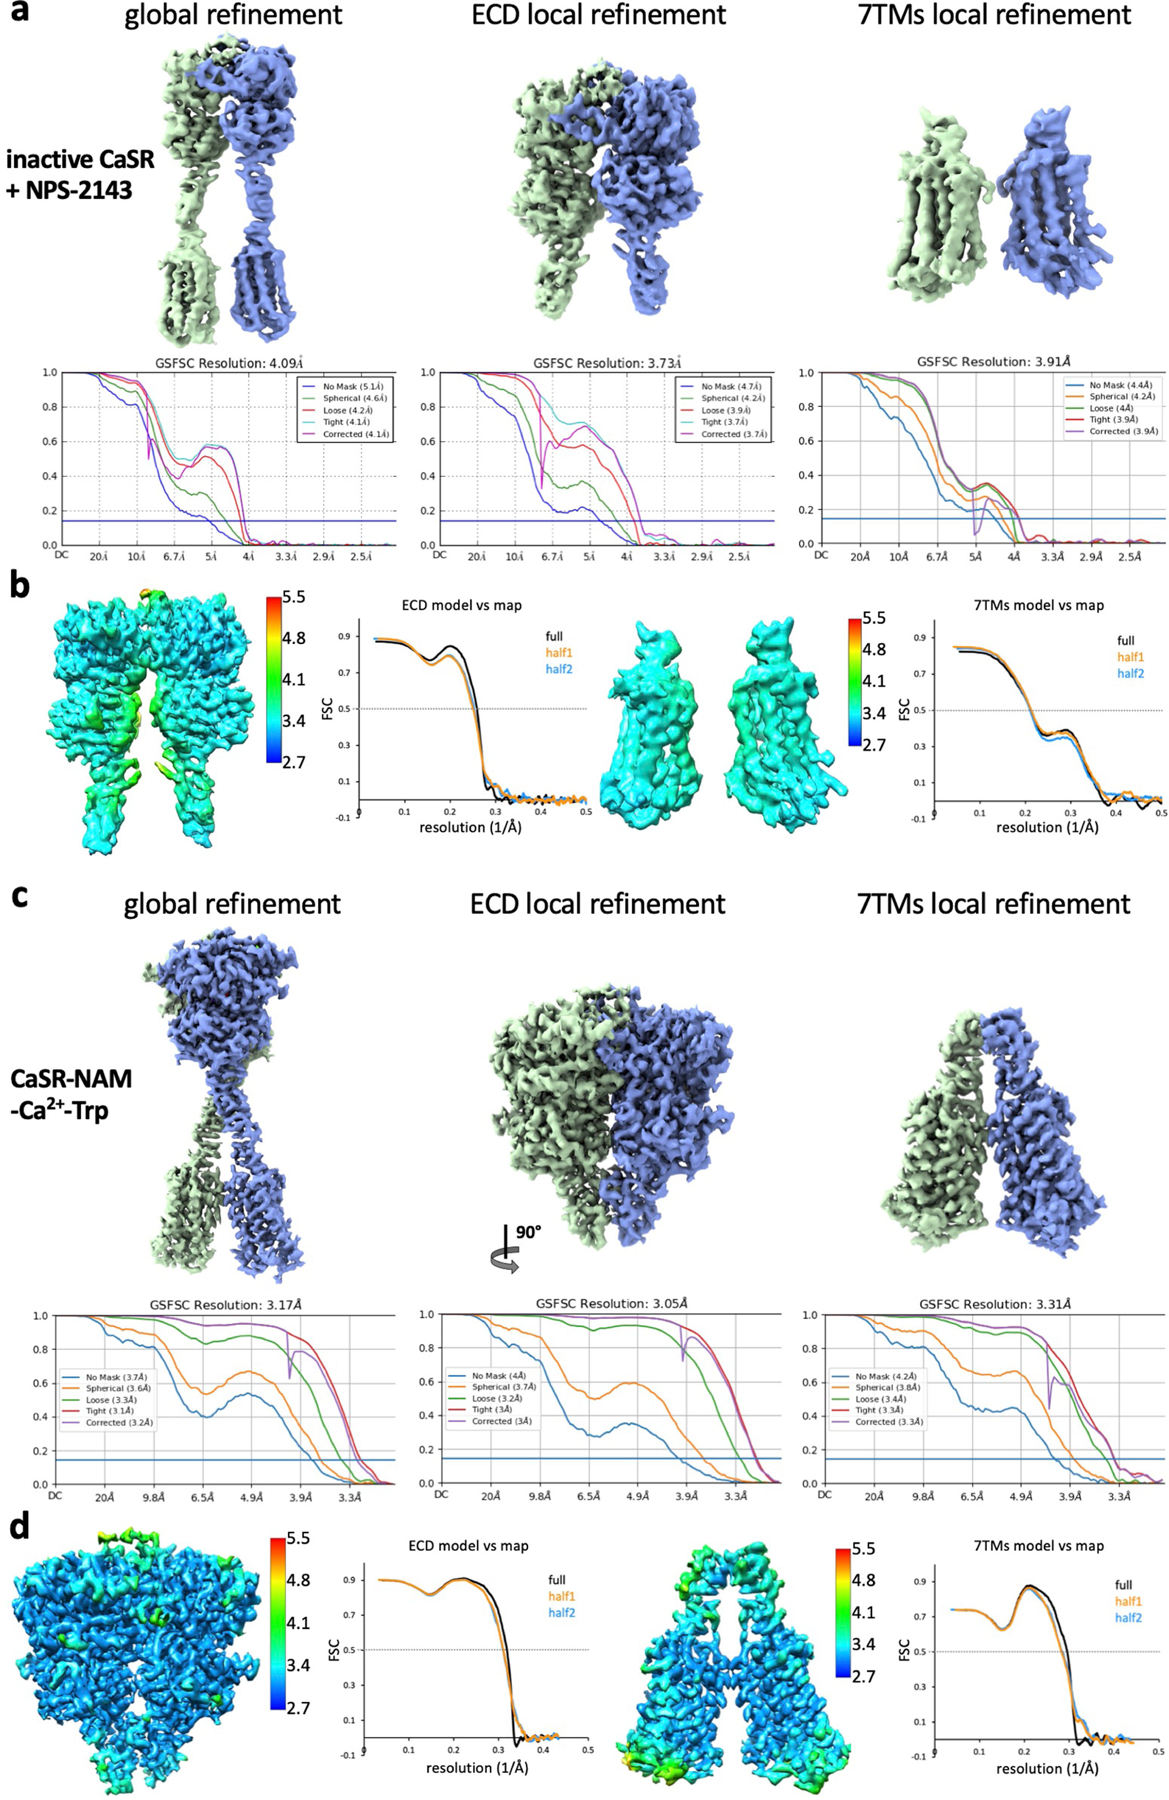
a–d, Global and local refinement maps with corresponding FSC curves indicating nominal resolutions using the FSC = 0.143 criterion, model-vs-map FSC curves and local resolution maps of inactive-state CaSR (a, b) and CaSR-NAM-Ca2+-Trp (c, d).