
Fig. 2. Autocrine P2Y11 receptor signaling regulates cell polarization and pseudopod formation.
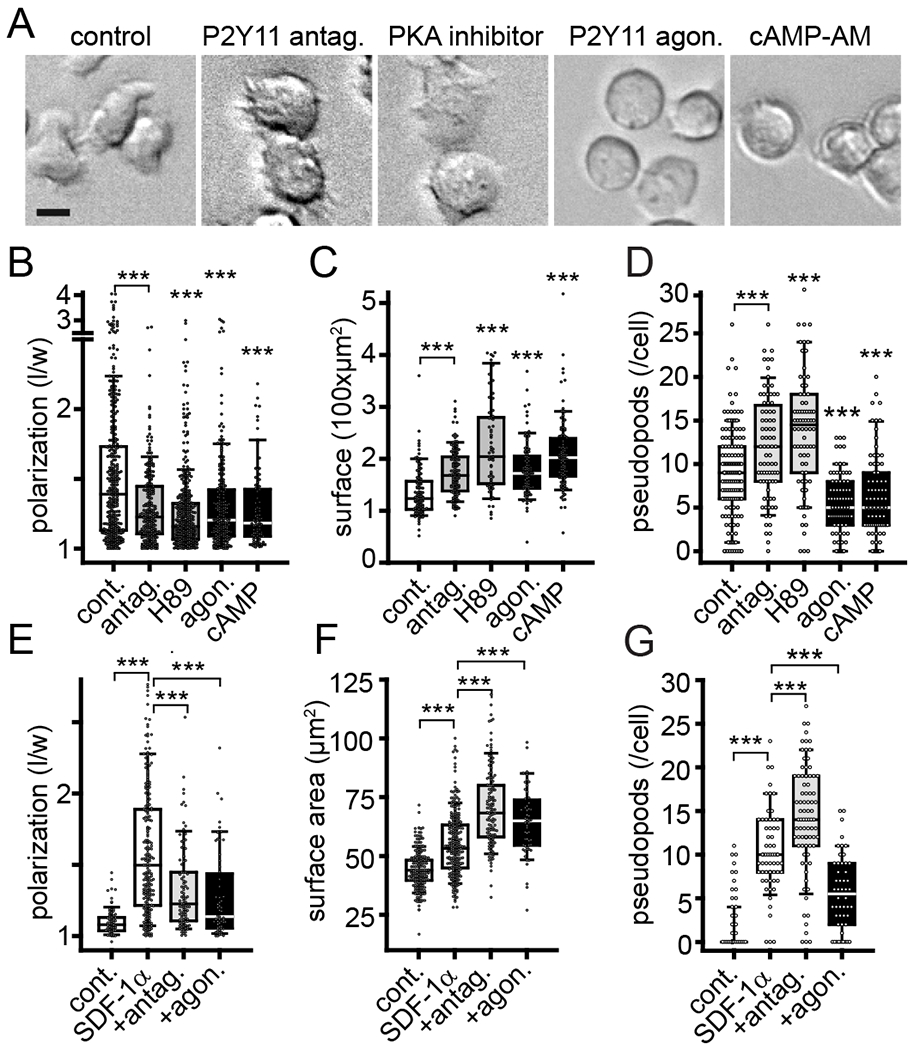
(A) Human effector CD4 T cells were obtained by stimulation for 3 days with anti-CD3/CD28 antibody-coated beads and then treated for 30 min with P2Y11 antagonist (NF340, 10 μM), PKA inhibitor (H89, 5 μM), P2Y11 agonist (NF546, 1 μM), or cell-permeable cAMP (cAMP-AM, 1 μM). Scale bar: 10 μm. (B-D) Cell polarization expressed as ratio between lengths and widths of individual cells (B), cell surface areas (C), and the number of pseudopods extended (D) were analyzed after treatment of effector T cells for 30 min with inhibitors and agonists. Box plots of n≥65 cells from at least 3 independent experiments are shown. Circles indicate single cells. ***P<0.001 compared to controls (Kruskal-Wallis test). (E-G) Freshly isolated naïve human CD4 T cells were treated with NF340 or NF546 for 10 min, stimulated with SDF-1α (100 ng/ml) or not (controls), and observed for 30 min by time-lapse video microscopy. Cell polarization (E), cell surface areas (F), and the number of pseudopods formed (G) were analyzed after 30 min. Box plots represent n≥50 cells (indicated by circles) from independent experiments (n≥3). ***P<0.001 compared to SDF-1α controls (Kruskal-Wallis test).