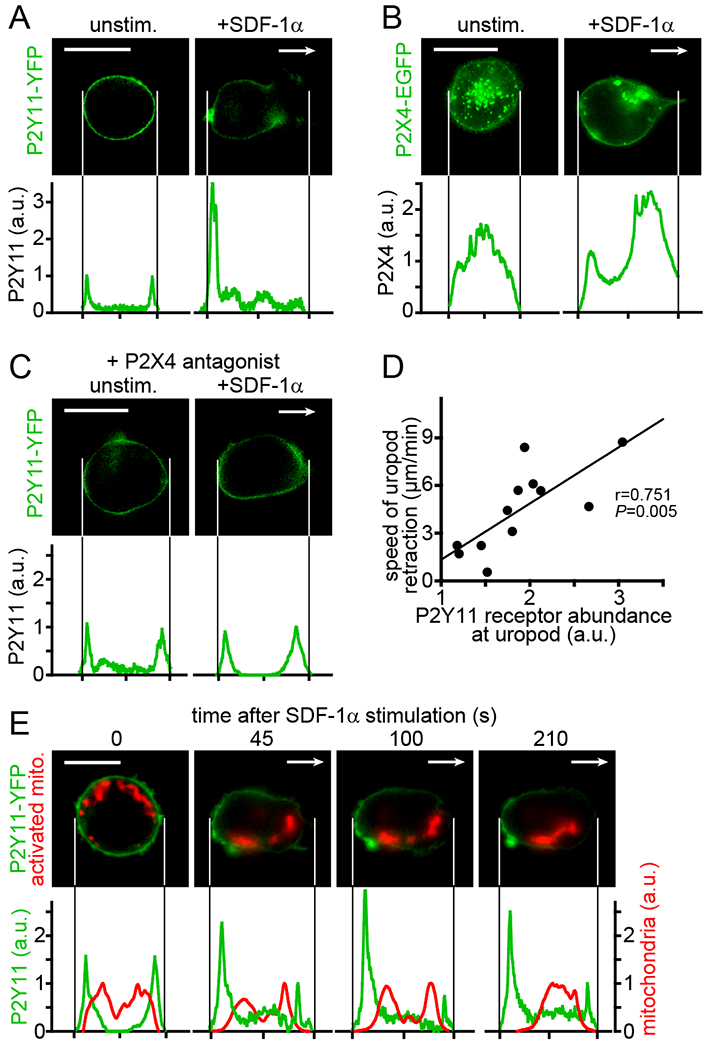
Fig. 3. P2X4 receptor signaling defines the subcellular redistribution of P2Y11 receptors during T cell polarization.

(A-C) P2Y11 and P2X4 receptor distribution patterns were analyzed in Jurkat cells expressing YFP-tagged P2Y11 or EGFP-tagged P2X4 receptors 10 min after the addition of SDF-1α (100 ng/ml) or vehicle control. In (C), cells were pre-incubated with the P2X4 receptor antagonist 5-BDBD (10 μM) for 10 min prior to stimulation. Arrows indicate the direction of cell migration. Images and corresponding receptor distribution profiles are representative of at least 20 (A, B) or 10 (C) cells from at least 3 separate experiments (scale bar: 10 μm). (D) Correlation between P2Y11 receptor accumulation at the back of cells and the uropod retraction speed in migrating cells. Uropod retraction was tracked for 2 min (n=12 cells from 3 independent experiments); r, Pearson’s correlation coefficient. (E) Jurkat cells expressing P2Y11-YFP were labeled with MitoTracker Red CM-H2Xros and the distribution of P2Y11 receptors and active mitochondria following stimulation with SDF-1α was recorded over time. Representative images of 10 cells from different experiments and corresponding distribution profiles of P2Y11-YFP and active mitochondria summed over the whole cell area are shown. Arrows indicate the direction of migration; scale bar: 10 μm.
