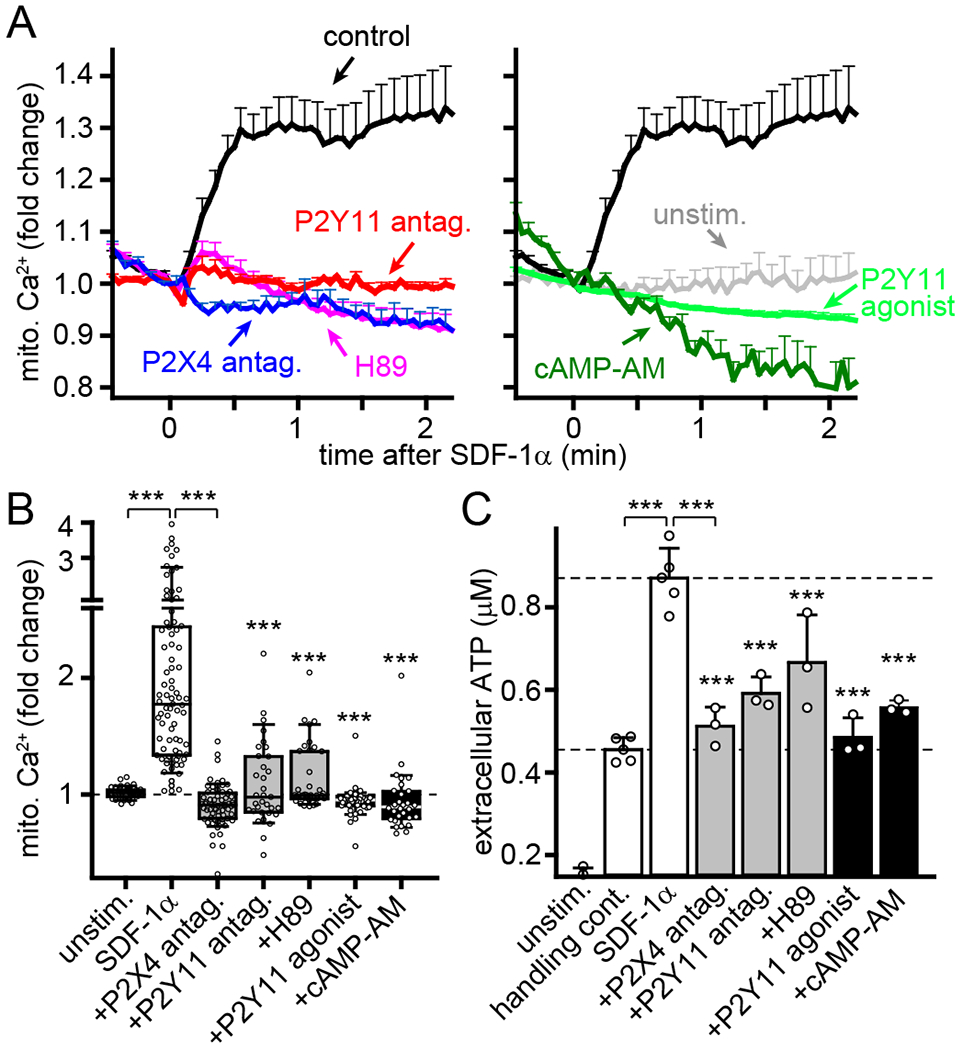
Fig. 5. P2X4 and P2Y11 receptor signaling regulates mitochondrial activity.

(A-B) Human CD4 T cells were labeled with Rhod-2 and treated for 20 min with P2X4 antagonist (5-BDBD, 10 μM), P2Y11 antagonist (NF340, 10 μM), PKA inhibitor (H89, 5 μM), P2Y11 agonist (NF546, 1 μM), or cell permeable cAMP (cAMP-AM, 1 μM). Mitochondrial Ca2+ levels following SDF-1α (100 ng/ml) stimulation were analyzed by fluorescence microscopy. Results show fold changes of mean Rhod-2 fluorescence values ± SEM (A) or peak fluorescence values (B) from 30-85 cells (indicated by circles) derived from separate experiments (n≥3); ***P<0.001 compared to SDF-1α-stimulated control (Kruskal-Wallis test). (C) Jurkat T cells were treated for 30 min with 5-BDBD, NF340, H89, NF546, or cAMP-AM, stimulated or not (unstim.) with SDF-1α (100 ng/ml) or vehicle (handling control), and ATP levels in the supernatants were determined after 5 min. Data are means ± SD, circles indicate independent experiments (n=3-5); *** P<0.001 compared to SDF-1α-stimulated control (one-way ANOVA).
