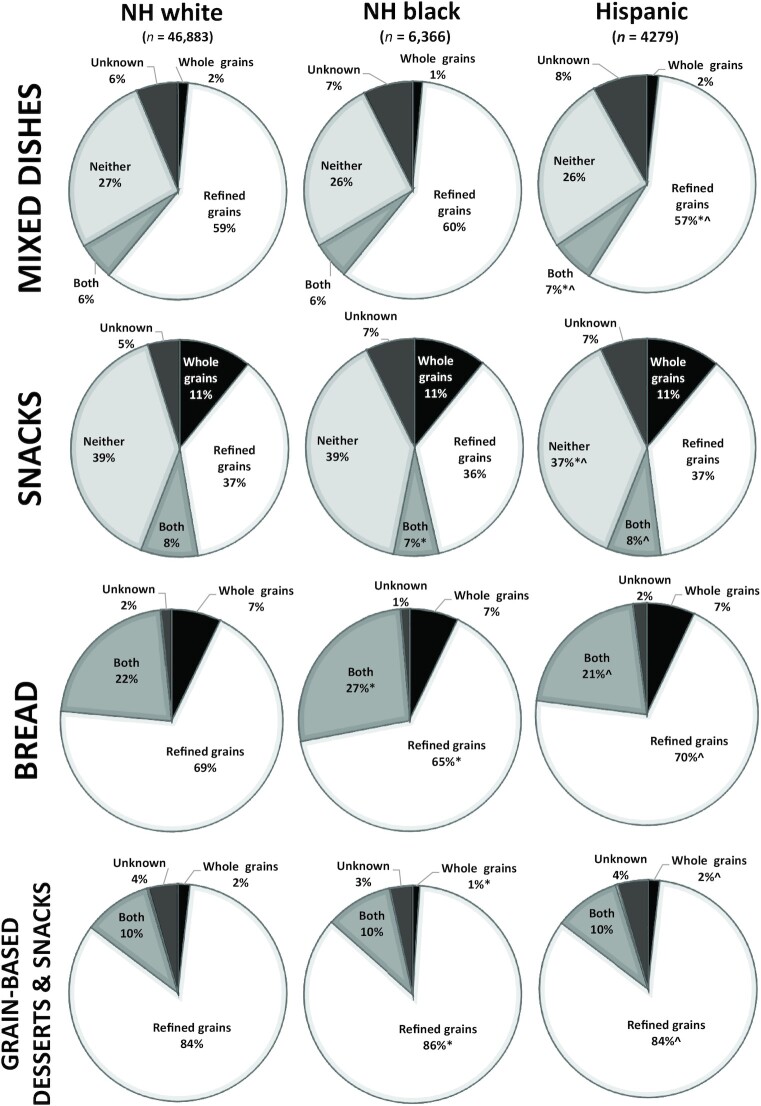
FIGURE 2.
Proportion of purchases by racial or ethnic group and grain status in selected food categories. University of North Carolina calculation based in part on data reported by NielsenIQ through its Homescan Services for all food categories including beverages for 2018 across the US market (14). Authors’ calculations based in part on data reported by NielsenIQ through its Homescan Services for all food categories including beverages for 2018 across the US market (14). *Different from non-Hispanic white (P < 0.0001); ^different from non-Hispanic black (P < 0.0001). NH, non-Hispanic.

