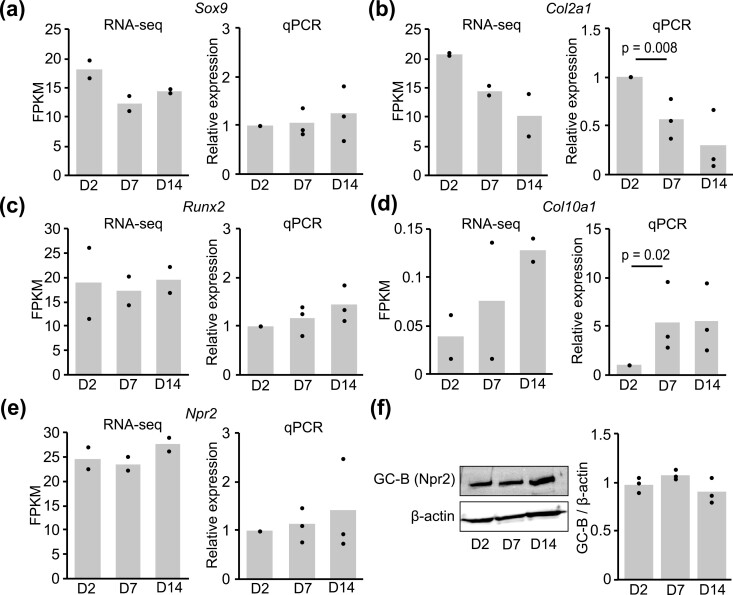
Figure 2.
Expression of chondrogenic differentiation marker genes. FPKM values and relative expression levels of Sox9 (A), Col2a1 (B), Runx2 (C), Col10a1 (D), and Npr2 (E) on days 2, 7, and 14 after induction of differentiation were obtained by RNA-Seq and quantitative real-time RT-PCR. In the results of RNA-Seq, each column represents the mean of 2 independent experiments, and plots represent each sample. In the results of RT-PCR, each column represents the mean of 3 independent experiments, and plots represent the mean of duplicate samples. Data are normalized against Hprt. (F) Total membrane proteins were extracted from ATDC5 cells on days 2, 7, and 14 after induction of differentiation and subjected to western blotting. The protein levels of GC-B (Npr2) were obtained and densitometry was carried out to evaluate the ratio of the intensity of the signals corresponding to GC-B to that of β-actin in the cells. Each column represents the mean of 3 independent experiments, and plots represent each sample.

