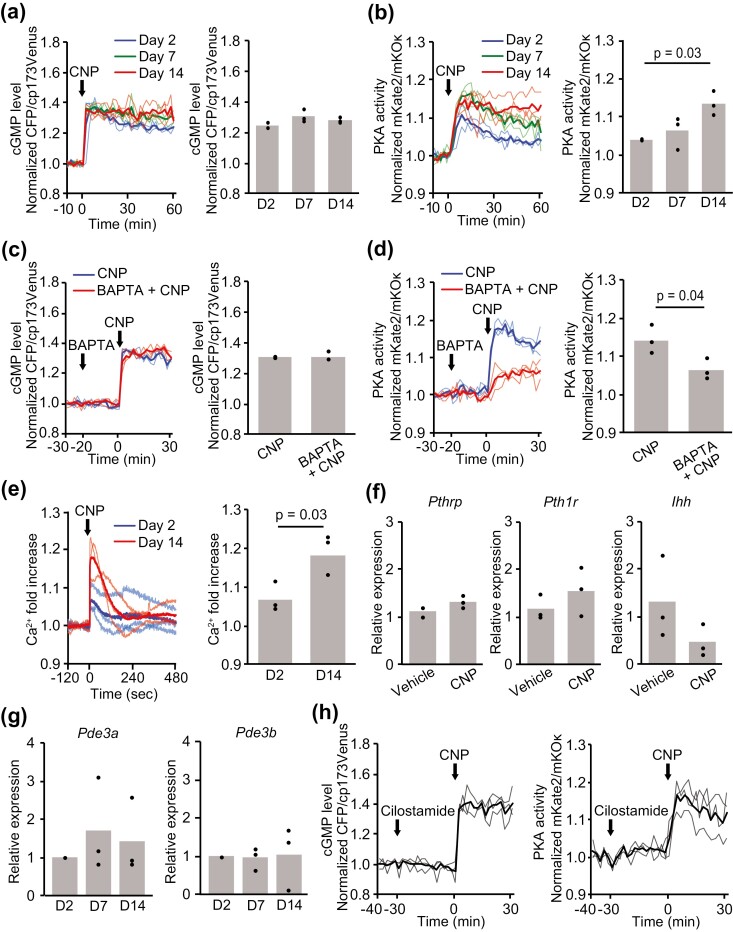
Figure 3.
Cell responses to CNP in each chondrogenic differentiation stage. (A, B) ATDC5 cells coexpressing cGMP and PKA biosensors were stimulated with CNP (100 nM) on days 2, 7, and 14 after the induction of differentiation. (A) Time course of the intracellular cGMP level represented as CFP/cp173Venus ratios and values at 60 minutes after CNP stimulation. (B) Time course of PKA activity represented as mKate2/mKOκ ratios and values at 60 minutes after CNP stimulation. CFP/cp173Venus and mKate2/mKOκ ratios are normalized to the average before CNP stimulation. (C, D) On day 14, ATDC5 cells coexpressing cGMP and PKA biosensors were stimulated with CNP (100 nM), following the addition of BAPTA-AM (32 μM). (C) Time course of the intracellular cGMP level represented as the CFP/cp173Venus ratio and (D) time course of PKA activity represented as the mKate2/mKOκ ratio normalized to the average before CNP stimulation. (E) ATDC5 cells expressing the Ca2+ biosensor were stimulated with CNP (100 nM) on days 2 and 14. The time course of the normalized fold increase of Ca2+ and the peak values after CNP stimulation are shown. Values were normalized to the average before CNP stimulation. (F) The relative expression levels of Pthrp, Pth1r, and Ihh in ATDC5 cells after 24 hours of treatment with CNP (100 nM) were obtained on day 14 by quantitative real-time RT-PCR. (G) The relative expression levels of Pde3a and Pde3b on days 2, 7, and 14 after induction of differentiation were obtained by quantitative real-time RT-PCR. (H) On day 14, ATDC5 cells coexpressing cGMP and PKA biosensors were stimulated with CNP (100 nM), following the addition of cilostamide (1 μM). Time course of the intracellular cGMP level represented as the CFP/cp173Venus ratio and time course of PKA activity represented as the mKate2/mKOκ ratio normalized to the average before cilostamide stimulation. In (A-G), each column represents the mean of 3 independent experiments, and plots represent the value of each sample.

