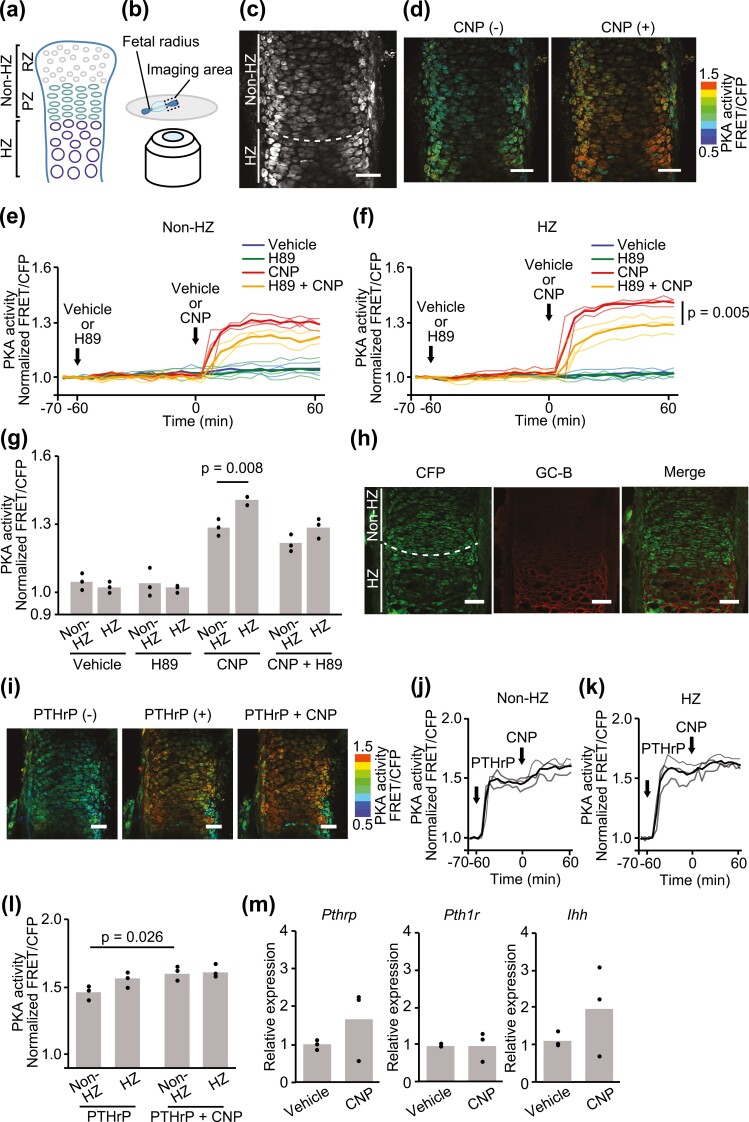
Figure 4.
PKA response to CNP in the PKAchu growth plate. (A) Structure of the growth plate. The growth plate was composed of resting (RZ), proliferative (PZ), prehypertrophic, and hypertrophic (HZ) zones. In this study, RZ and PZ were included in the nonhypertrophic zone (non-HZ) and the prehypertrophic zones were included in the HZ. (B) A schematic diagram of the imaging system. Radial explants of PKAchu mice were fixed on the glass bottom dish using agarose. Proximal growth plates were observed using a multiphoton fluorescence microscope under ex vivo culture conditions. (C) CFP image of the fetal proximal radial growth plate of PKAchu mice. A white dashed line divides the growth plate into the non-HZ and HZ as indicated. (D) The radial growth plates of PKAchu mice were stimulated with CNP (100 nM). FRET/CFP ratio images are shown in the IMD mode. Bar, 50 μm. (E-G) The radial growth plates of PKAchu mice were stimulated with CNP (100 nM), following the addition of vehicle or H89 (20 nM). (E, F) Time course of PKA activity represented as the normalized FRET/CFP ratio in the (E) non-HZ and (f) HZ. (G) Normalized FRET/CFP ratios at 60 min. (h) GC-B staining of the proximal radial growth plates at E17.5. Bar, 50 μm. (I-L) The radial growth plates of PKAchu mice were stimulated with CNP (100 nM), following the addition of PTHrP (100 nM). (I) FRET/CFP ratio images are shown in the IMD mode. Bar, 50 μm. (J, K) Time course of PKA activity represented as the normalized FRET/CFP ratio in the (J) non-HZ and (K) HZ. (G) Normalized FRET/CFP ratios at 0 minutes (PTHrP) and 60 minutes (PTHrP + CNP). (M) The relative expression levels of Pthrp, Pth1r, and Ihh in growth plate chondrocytes after 24 hours of treatment with CNP (100 nM) under organ culture conditions were obtained by quantitative real-time RT-PCR. Each column represents the mean of 3 independent experiments, and plots represent the value of each sample. FRET/CFP ratios are normalized to the average value before drug treatment.

