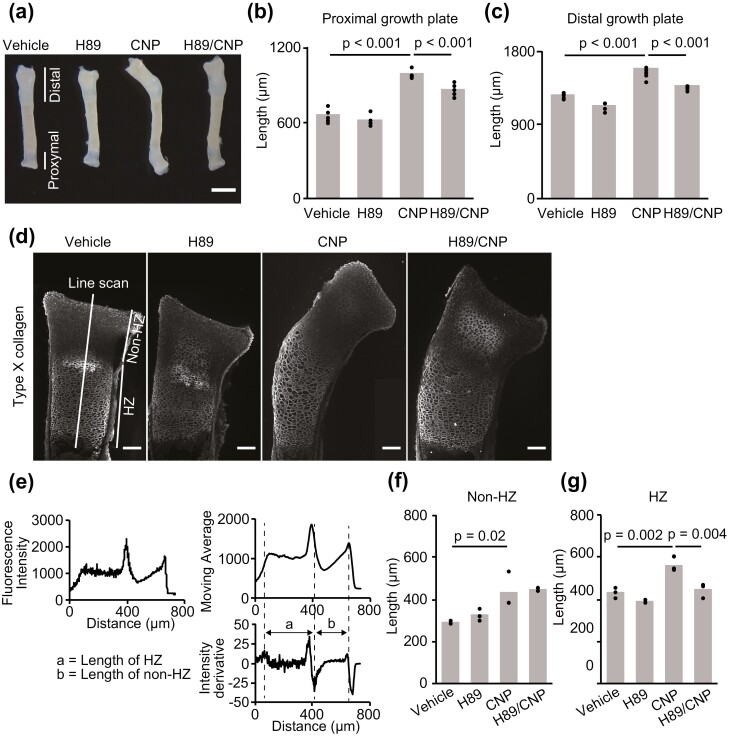
Figure 5.
Histological analysis of the growth plate of PKAchu mice. (A) Gross appearance of radial explants incubated with vehicle, H89, CNP, or both H89 and CNP (H89/CNP) for 3 days. Bar, 1 mm. (B, C) Length of the (B) proximal and (C) distal growth plates of the vehicle, H89, CNP, or H89/CNP-treated groups at the end of the organ culture period. Each column represents the mean of 5 or 6 independent experiments, and plots represent the value of each sample. (D) Type X collagen staining of the proximal growth plates of each group at the end of the organ culture period. Fluorescence intensity along the long axis of the proximal growth plate was acquired using the line scan function in MetaMorph. Bar, 50 μm. (E) Scheme of the measurement of histological sections. The value of fluorescence intensity is shown in the left upper panel. Right upper and lower panels: moving average of fluorescence intensity and its derivative. Dashed lines represent the end of the HZ, the border between the HZ and non-HZ, and the end of the epiphysis, respectively. The length of the HZ is shown with the letter a and the length of the non-HZ is shown with the letter b in the right lower panel. (F, G) Length of the (F) non-HZ and (G) HZ of the vehicle, H89, CNP, and H89/CNP-treated groups. Each column represents the mean of 3 independent experiments, and plots represent the value of each sample.

