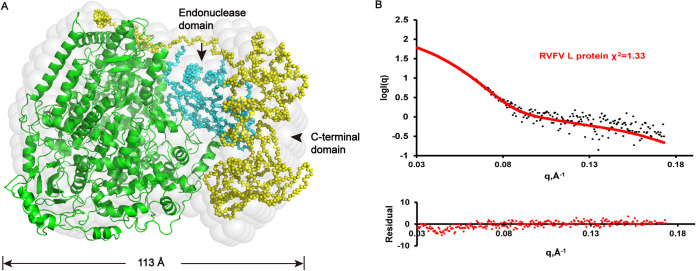
FIG 4.
Superposition of low-resolution ab initio model and rigid body model. (A) The ab initio model is shown as light-gray spheres. PA-like, PB1-like, and PB2-like N-terminal domains of RVFV L protein are colored in green. The simulated endonuclease domain and the C-terminal domain of the PB2-like region are colored in cyan and yellow, respectively. (B) Upper: Comparison of SAXS experimental data and calculated scattering profiles. Experimental data are represented in black dots. The data calculated from the RVFV L protein (1.25 mg/ml) is in red. Lower: Error-weighted residual difference plot.

