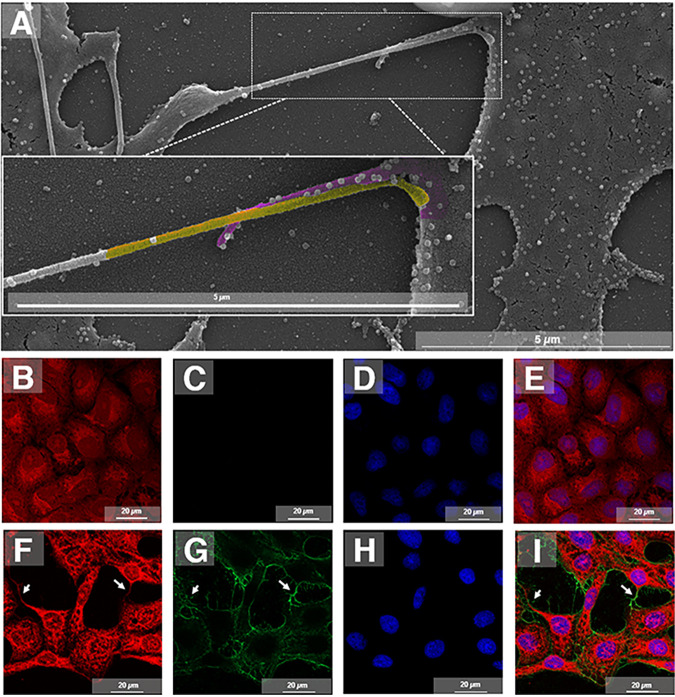
FIG 6.
Virus cell distribution and connection between cells by cell membrane protrusions. Vero cells were infected with chikungunya virus (CHIKV) at a multiplicity of infection (MOI) of 5.0 and assessed at 8 hpi by scanning electron microscopy (SEM). Two actin tails from different cells (cell one, yellow; cell two, purple) connected with multiple viruses along with the protrusions (A). Vero cells were infected with CHIKV at an MOI of 5.0 and assessed at 8 hpi by immunofluorescence microscopy. (B to E) Control cells mock-infected with the cytoskeleton stained with Evans blue (in red) (B), labeled with Alexa Fluor 488 (C), nuclei stained with DAPI (in blue) (D), and merged images (E). (F to I) Immunofluorescence of CHIKV infection shows the cytoskeleton stained with Evans blue (in red) (F), the virus distribution over the cell surface and connections labeled with Alexa Fluor 488 (in green) (G), nuclei stained with DAPI (in blue) (H), and colocalization of the virus and cell connections (I). White arrows indicate the connections between cells. Immunofluorescent images are shown with scale bars. Bars, 5 μm (A); 20 μm (B to I).

