FIG 4.
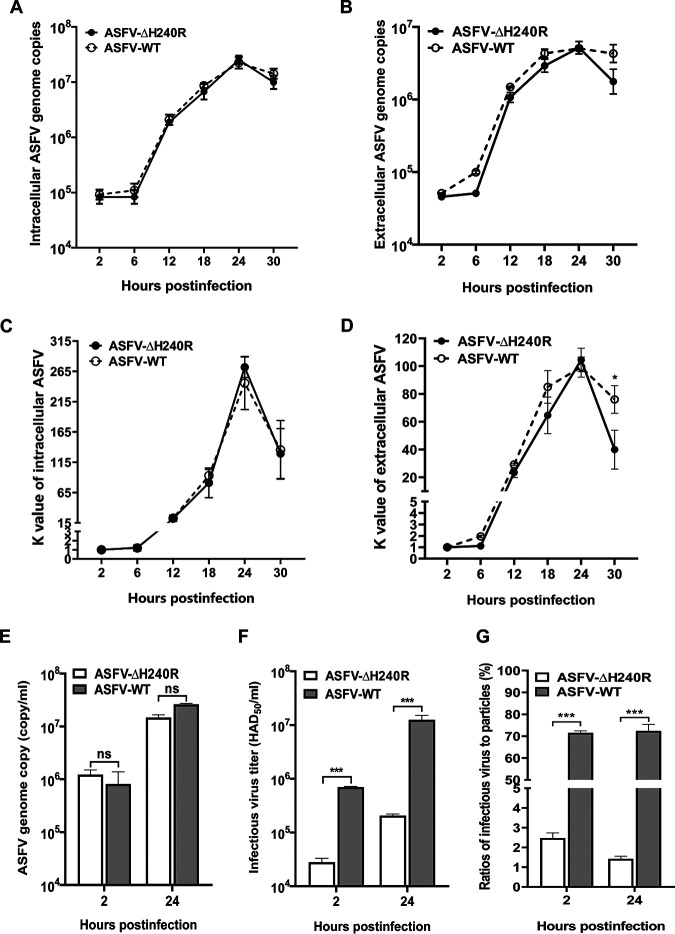
ASFV-ΔH240R shows decreased viral production but normal genome replication in primary porcine alveolar macrophages (PAMs). (A and B) Intracellular (A) and extracellular (B) genome copies of ASFV-ΔH240R or ASFV HLJ/2018 (ASFV-WT). PAMs in 24-well plates were infected with either ASFV-ΔH240R or ASFV-WT at an MOI of 3. At the indicated hpi, the numbers of genome copies in the cell lysates or supernatants of infected PAMs were determined by quantitative PCR (qPCR). (C and D) Dynamics of intracellular or extracellular ASFV replication. The intracellular (C) or extracellular (D) K value represents the proliferation curve of the virus at each time point and is calculated by dividing the number of virus genome copies at each time point by that at 2 h. The viral proliferation curves were generated using the virus genome copies at 2, 6, 12, 18, 24, and 30 hpi. (E) Genome copies of progeny ASFV-ΔH240R or ASFV-WT. PAMs in 24-well plates were infected with either ASFV-ΔH240R or ASFV-WT at genome copies of 107. At the indicated hpi, the numbers of genome copies in supernatants were determined by qPCR. (F) Infectious progeny virus production of ASFV-ΔH240R or ASFV-WT. The titers of infectious progeny virions from panel E were detected based on the Reed and Muench calculation method. (G) ASFV-ΔH240R or ASFV-WT infectious virus-to-particle ratios. The infectious virus-to-particle ratios were calculated based on the ratio of the titers (E) to the genome copies (F) at 2 or 24 hpi (n = 3). The data shown are from three independent experiments. Error bars denote standard errors of the means. The significance of differences between groups (n = 3) was determined using Student's t test (*, P < 0.05; ***, P < 0.001). ns, not significant.

