FIG 8.
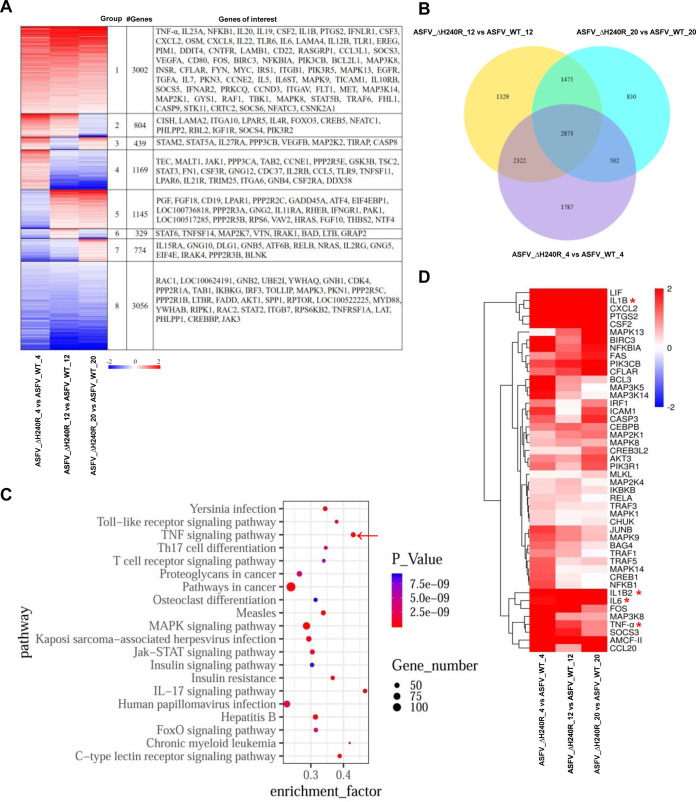
Gene expression profiling in the ASFV-ΔH240R-infected primary porcine alveolar macrophages (PAMs) by RNA-sequencing analysis. (A) Hierarchical clustering analysis of differentially expressed genes (DEGs) in the groups of ASFV-ΔH240R versus ASFV HLJ/2018 (ASFV-WT). PAMs were mock infected or infected with ASFV-ΔH240R or ASFV-WT for 4, 12, and 20 h. Total RNA was extracted from the PAMs and sequenced using the Illumina HiSeq 2500 platform. Each group of DEGs and genes of interest is shown on the right. (B) Venn diagrams of mRNAs in different groups. The overlapping section represents the number of common mRNAs in each group, while the nonoverlapping sections represent the numbers of group-specific mRNAs. (C) Top 20 pathways from KEGG enrichment analysis of 3,002 upregulated genes. The TNF signaling pathway is indicated by a red arrow. (D) Analysis of the 46 upregulated genes in the TNF signaling pathway induced by ASFV-ΔH240R versus ASFV-WT in the three groups. Asterisks indicate upregulated expression of target genes.

