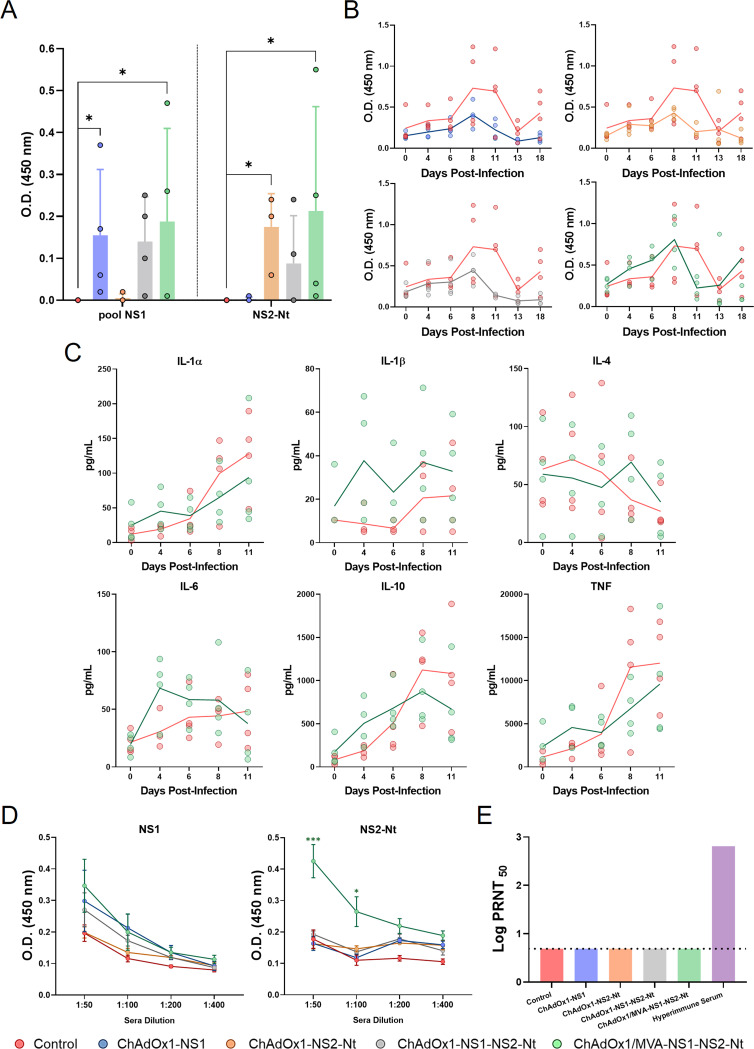
FIG 10.
Immunogenicity of vaccine candidates in sheep. (A) IFN-γ levels measured in prechallenge sheep plasma by capture ELISA. Sera from immunized sheep were stimulated for 72 h 4 weeks postprime (prime-only) or 4 weeks postboost (ChAdOx1/MVA-NS1-NS2-Nt) with 10 μg/mL of a pool of NS1 peptides, 10 μg/mL of NS2-Nt or left untreated. Points represent individual values for each sheep, bars represent the mean values of each group and error bars represent SD. Asterisks denote significant differences between stimulated samples of immunized and nonimmunized control mice (P < 0.05) (The Mann–Whitney U test). (B) IFN-γ levels measured in postchallenge sheep plasma by capture ELISA. Points represent individual values for each sheep and lines represent the mean values of each group. Data were analyzed by two-way ANOVA (post hoc Tukey test for multiple comparisons). (C) Cytokine presence in plasma from ChAdOx1/MVA-NS1-NS2-Nt immunized sheep and nonimmunized sheep after challenge. Points represent individual values for each sheep and lines represent the mean values of each group. Data were analyzed by two-way ANOVA (post hoc Tukey test for multiple comparisons). (D) Induction of IgG NS1 and NS2-Nt antibodies by indirect ELISA in vaccinated animals. Sera dilutions are indicated in the x axis. Points represent the mean values of each group and error bars represent SD. Asterisks denote significant differences between immunized and control sheep. * P value < 0.05, *** P value < 0.001, using two-way ANOVA (post hoc Tukey test for multiple comparisons). (E) Neutralizing antibodies titers against BTV-4M in immunized sheep by plaque reduction neutralization assay. Cut-off: 0.69 (log10 5). Hyperimmune serum: serum from sheep infected with BTV-4M. Bars represent the mean values of each group. Data were analyzed by the Mann–Whitney U test.

