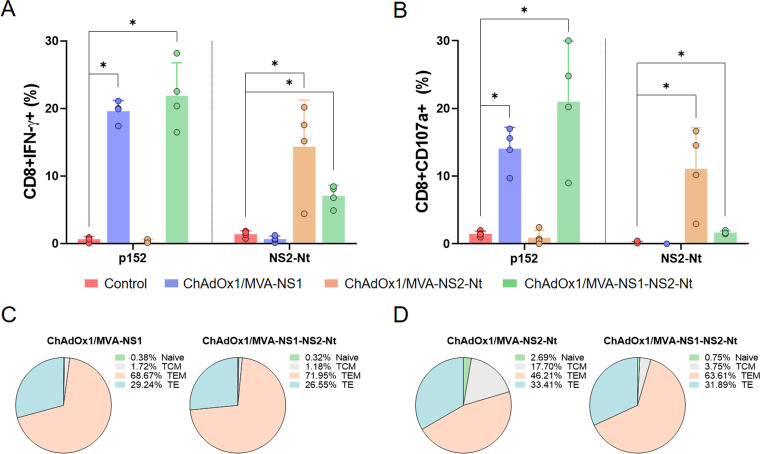
FIG 5.
Cellular immune responses against BTV in ChAdOx1/MVA immunized mice. Percentage of CD8+IFN-γ+T cells (A) and CD8+CD107a+ T cells (B) after stimulation with peptide 152 (NS1) and NS2-Nt. Points represent individual values for each mouse, bars represent the mean values of each group and error bars represent SD. Asterisks denote significant differences between immunized and control mice (P < 0.05) (The Mann–Whitney U test). * P value < 0.05. (C, D) Pie charts represents the phenotypic profile of BTV-specific CD8+ T cells of immunized mice. CD127 and CD62L expression was used to identify naive, TCM, TEM, and TE subpopulations. Each slice corresponds to the proportion of each BTV-specific CD8+ T cell subpopulations within the total NS1 (C) or NS2-Nt (D) specific CD8+ T cells producing IFN-γ.

