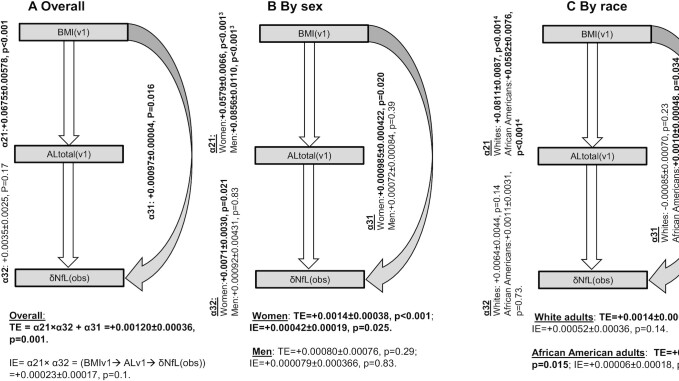
FIGURE 2.
BMI at v1 → AL at v1 → δNfLobs, overall and by sex and race: structural equations model; HANDLS (Healthy Aging in Neighborhoods of Diversity Across the Life Span), 2004–2017. Values are unstandardized path coefficients α ± SE, TEs, direct effects, and IEs with associated P values. See Table 4 for sample sizes, overall and by strata. Exogenous variables in the models were age, sex, race, poverty status, educational attainment, current drug use, current tobacco use, Healthy Eating Index-2010, total energy intake, the Center for Epidemiologic Studies-Depression total score, and the inverse Mills ratio. 1P value associated with null hypothesis of no difference in path coefficient α, by sex, using the Wald test (χ2 test, 1 df) for group invariance. 2P value associated with null hypothesis of no difference in path coefficient α, by race, using the Wald test (χ2 test, 1 df) for group invariance. *AL, allostatic load; IE, indirect effect; TE, total effect; v1, visit 1; δNfLobs, observed annualized rate of change in plasma neurofilament light chain between visit 1 and visit 3.

