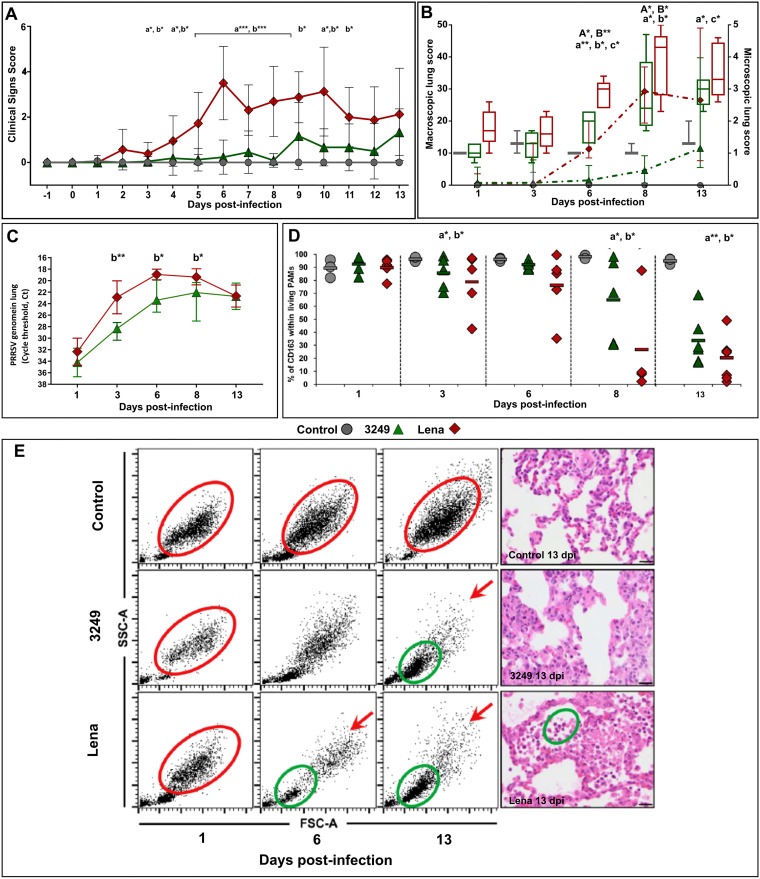
FIG 1.
PRRSV lung viral load was quantified by RT-qPCR (A). Viral load is represented by changes in the quantification cycle (Cq) (control, gray circles; 3249, green triangles; Lena, red diamonds). Frequency of live CD163+ PAMs (B). Freshly isolated BAL cells from control and PRRSV-1-infected pigs were stained and analyzed for the expression of CD163 by FCM. The scatter dot plot shows the frequency of CD163+ cells in control, 3249, and Lena group along the experimental infection. Changes in BAL cells subpopulation by FCM (FSC-A versus SSC-A) according to histopathological findings from a representative pig of the control, 3249, and Lena infected group at 1, 6, and 13 dpi (C). Red circles indicate living potential PAMs according to light scatter properties (size and granularity). Red arrows show the decrease of the above-mentioned subset in 3249- and Lena-infected pigs. Green circles indicate a mixture of neutrophils, monocytes, and, to a lesser extent, lymphocytes, according to light scatter properties. Microscopic pictures for each representative animal at 13 dpi supporting FCM findings. Bars, 20 μm. Statistical differences between groups are indicated (*, P < 0.05; **, P < 0.01).

