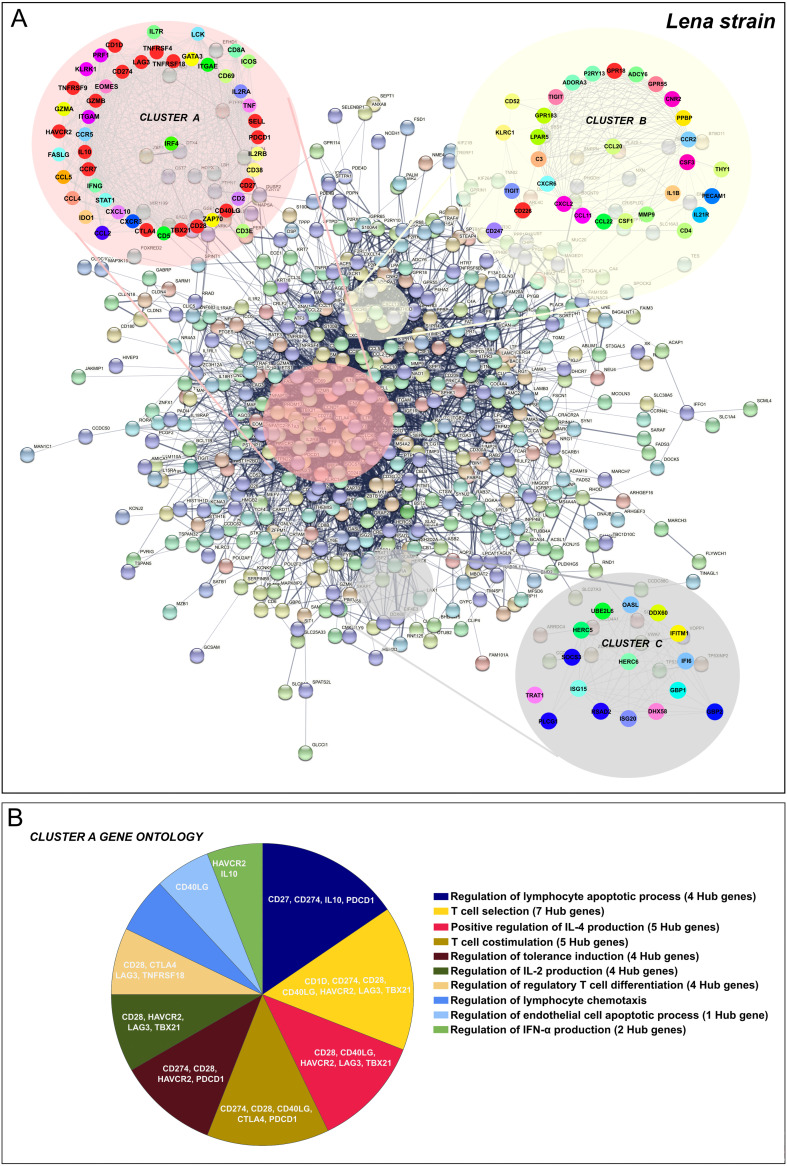
FIG 13.
PPI network of 1,227 overlapped DEGs in response to Lena strain infection at 8–13 dpi (A). Network was constructed by STRING database and visualized by Cytoscape, underlining the significant clusters A, B, and C (k-core > 6), which were identified by means of MCODE. The genes calculated by Maximal Clique Centrality (MCC) and Density of Maximum Neighborhood Component (DMNC) algorithms were selected as Hub genes (genes with the highest degree of connectivity) by CytoHubba plugin in Cytoscape. Most of the Hub genes (red color) were included in cluster A. GO enrichment analysis (BPs and ISPs categories) of DEGs included within cluster A (B). Overview pie chart showing the proportion of genes associated with the top functional groups, indicating the name of Hub genes in each term. Table 3 lists the top terms of GO (BPs and ISPs).

