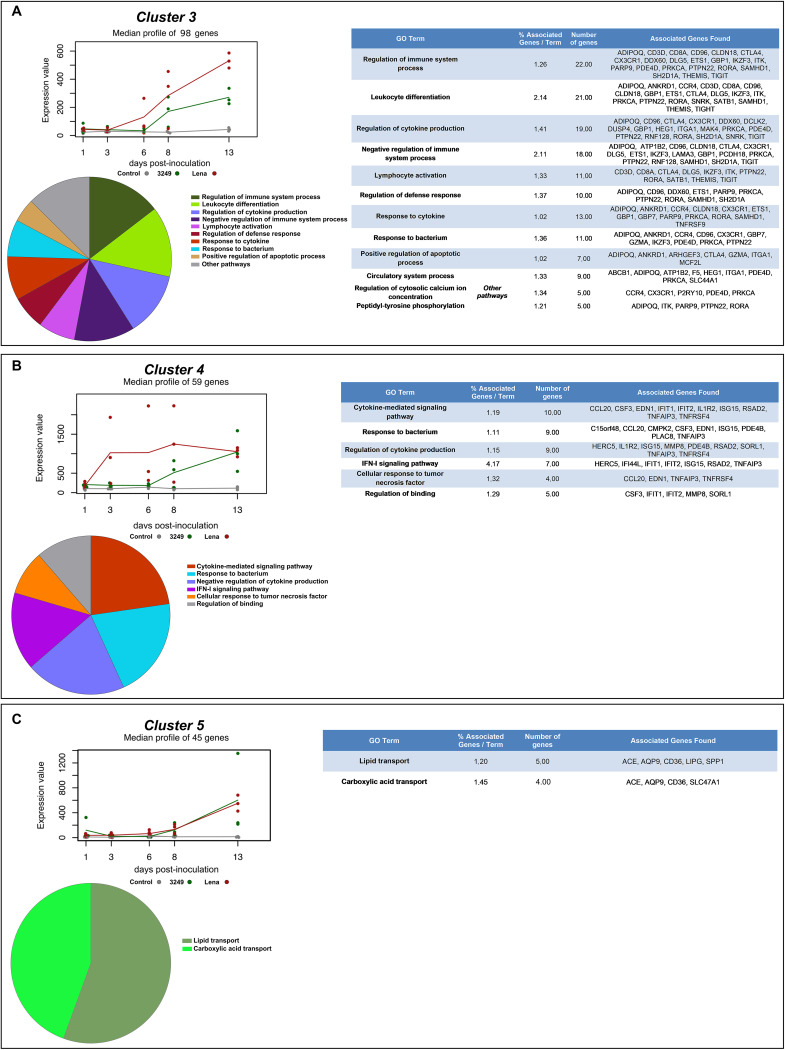
FIG 2.
MaSigPro analysis of RNA-seq time-series data set. Clusters 3 (A), 4 (B), and 5 (C) showed distinct temporal profiles associated with low-virulent 3249 and virulent Lena strain infection. The median expression of all genes in each cluster was plotted for control (gray), 3249 (green), and Lena strain (red) along the different time points. Solid lines depicting the median and solid plots show the individual value. Gene Ontology (GO) analysis of clusters 3 (A), 4 (B), and 5 (C). ClueGO and CluePedia were used to conduct a functional enrichment analysis. Tables list the top terms of GO biological processes (BPs) and immune system processes (ISPs) associated with genes grouped in each cluster over time. Overview pie chart shows the proportion of genes associated with the top functional groups.

