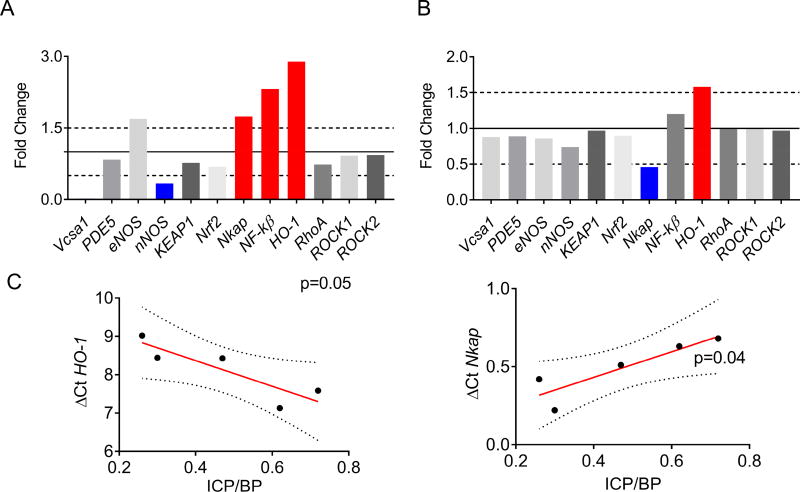
Figure 4. Quantitative reverse transcription PCR analysis of corporal tissue.
(A) Comparison of gene expression by RT-qPCR between ZDF fatty and lean rats expressed in fold change. RPL19 was used as the reference gene. Red bars denote upregulated genes and blue bars denote downregulated genes. The solid line represents relative gene expression in the lean animals (control). (B) Comparison of fold-change in gene expression between curc-np and blank-np (control) treated diabetic ZDF rats. (C) Linear regression analysis between gene expression of ho-1 and (D) nkap and ICP/BP following CN stimulation between 0.75 and 1.0mA. The y-axis (ΔCt) represents the amount of target gene normalized by the reference gene (RPL19). Ct (threshold cycle) values are inverse to the amount of RNA in the sample. Dotted line represents 95% confidence intervals. P< 0.05 denotes statistical significance.

