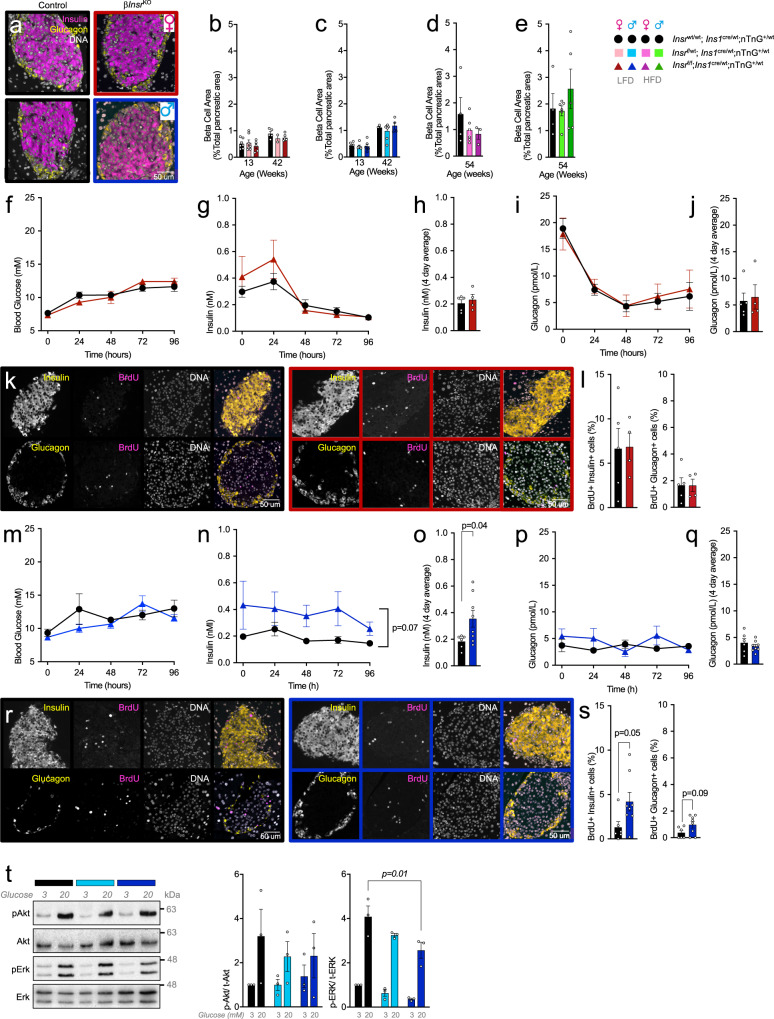
Fig. 5. Islet cell proliferation and relative area in mice lacking β-cell Insr.
a Representative images showing islet architecture via staining for insulin (pink), glucagon (yellow) and DNA (white) in control (black frame) and βInsrKO mice (female = red frame; male = blue frame). Similar results were observed in independent experiments (female n = 5 control, four βInsrKO and male n = 6 control, eight βInsrKO mice). b–e β-cell area shown as a percentage of total pancreatic area. βInsrWT (black bars), βInsrHET (LFD-fed female = light pink bars; LFD-fed male = light blue bars; HFD-fed female = bright pink bars; HFD-male = bright green bars) and βInsrKO (LFD-fed female = dark red bars; LFD-fed male = dark blue bars; HFD-fed female = purple bars; HFD-male = dark green bars). Data were analyzed by one-way ANOVA analyses. f–s 4-day in vivo glucose infusion in LFD-fed 10-week-old female control (n = 5, black lines, solid circles), βInsrKO (n = 4, dark red lines, solid triangles) and male control (n = 6, black lines, solid circles), βInsrKO (n = 8, dark blue lines, solid triangles) mice. f, m Tail blood glucose (mM) and g, n insulin (nM) data were analyzed using repeated measures mixed effects models. h, o Four days average plasma insulin (nM) data were analyzed by an two-sided unpaired student’s t-test. i, p Plasma glucagon (pmol/L) (tail blood) data were analyzed using repeated measures mixed-effects model. j, q Four days average plasma glucagon (pmol/L) data were analyzed by an two-sided unpaired student’s t-test. k, r Representative single channel (white) and merge images showing islets stained for insulin (yellow, upper panel), glucagon (yellow, lower panel), BrdU (pink) and DNA (white) from LFD-fed female and male controls and female βInsrKO and male βInsrKO mice following four day glucose infusion. Similar results were observed in independent experiments (female control n = 5, female βInsrKO n = 4, male control n = 6, male βInsrKO n = 8). l, s Quantification of BrdU+ insulin+ cells (% all insulin+ cells) and BrdU+ glucagon+ cells (% all glucagon+ cells). Data were analyzed by two-sided unpaired Student’s t-tests. t Representative western blot image and quantification of islet lysate from LFD-fed 12-week old male Insrwt/wt;Ins1cre/wt;nTnG (black bar, n = 3), Insrf/wt;Ins1cre/wt;nTnG (light blue bar, n = 3), Insrf/f;Ins1cre/wt;nTnG (dark blue bar, n = 3) mice treated with 3 or 20 mM glucose. Data were analyzed by one-way ANOVA. All animals/samples were handled in a strictly blinded. All data are presented as mean values ± SEM. Source data are provided as Source Data file.

