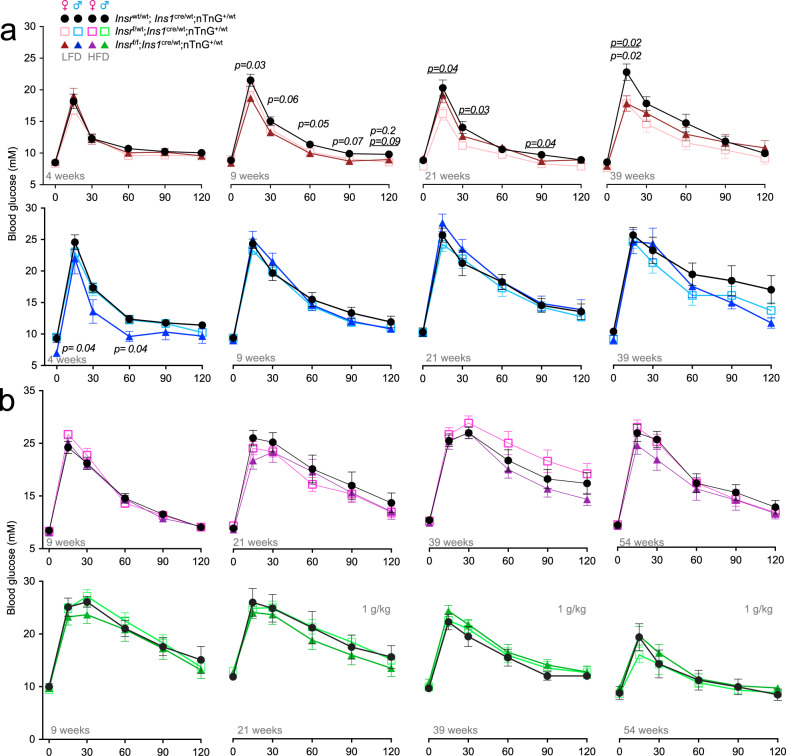
Fig. 7. Glucose tolerance at multiple ages in β-cell specific Insr knockout mice fed 2 different diets.
a Tail blood glucose levels (mM) from glucose tolerance tests of LFD-fed females (control (black lines, solid circles), βInsrHET (light pink, open squares), βInsrKO, (dark red lines, solid triangles)); (n4week = 16, 16, 14; n9week = 23, 25, 17; n21week = 12, 15, 12; n39week = 8, 12, 10) and males (control (black lines, solid circles), βInsrHET (light blue, open squares), βInsrKO (male = dark blue, solid triangles); (n4week = 10, 18, 5; n9week = 17, 30, 11; n21week = 8, 14, 8; n39week = 9, 7, 13). b Tail blood glucose levels (mM) from glucose tolerance tests of HFD-fed female (control (black lines, solid circles), βInsrHET (bright pink, open squares), βInsrKO (purple lines, solid triangles)); (n9week = 17, 17, 14; n21week = 12, 14, 12 n39week = 14, 16, 10; n54week = 10, 13, 11) and male (control (black lines, solid circles), βInsrHET (bright green, open squares), βInsrKO (dark green lines, solid triangles)); (n9week = 7, 16, 9; n21week = 7, 16, 8; n39week = 8, 14, 8; n54week = 6, 11, 7) mice. All mice received a glucose bolus of 2 g glucose/kg body mass (i.p) except older HFD-fed males, which received only 1 g glucose/kg body mass (i.p). *p-values are italicized when βInsrKO was compared to controls, p-values are italicized and underlined when βInsrHET was compared to controls. Data were analysed by a fitted mixed-effects model with correction for multiple comparisons using Dunnett’s method. All animals/samples were handled in a strictly blinded manner. All data are presented as mean values ± SEM. Source data are provided as Source Data file.

