
Fig. 5. Correlation of values for each molecule.
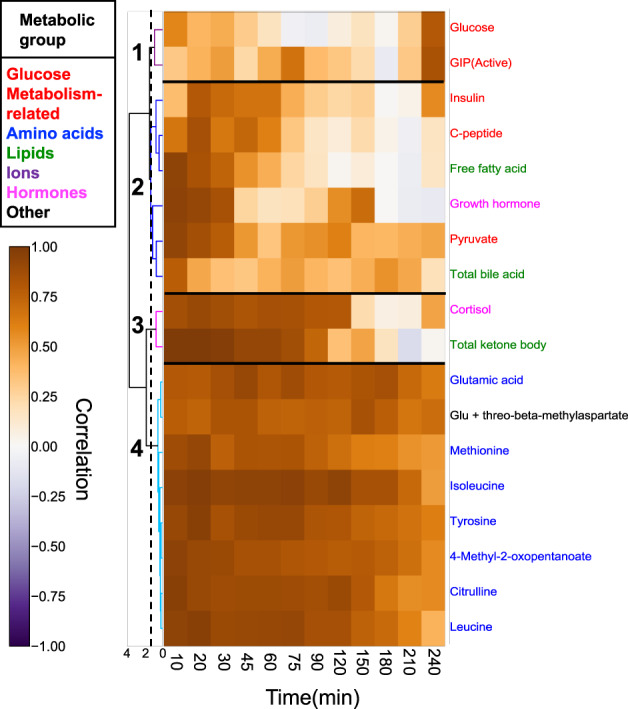
A heat map shows the correlation coefficients between the fasting and each time point (in minutes (min)) among individuals. The 18 glucose-responsive molecules showed a significant change after glucose ingestion was selected. Molecules are ordered by hierarchical clustering using Euclidean distance and Ward’s method. The colours and numbers on the tree diagram indicate the cluster of each molecule. The dashed line indicates the threshold for dividing the cluster. The colours assigned to the names of molecules correspond to the metabolic group (inset). Abbreviations for the molecules are follows: GIP (active), gastric inhibitory polypeptide (active); Glu glutamic acid.