
FIGURE 1.
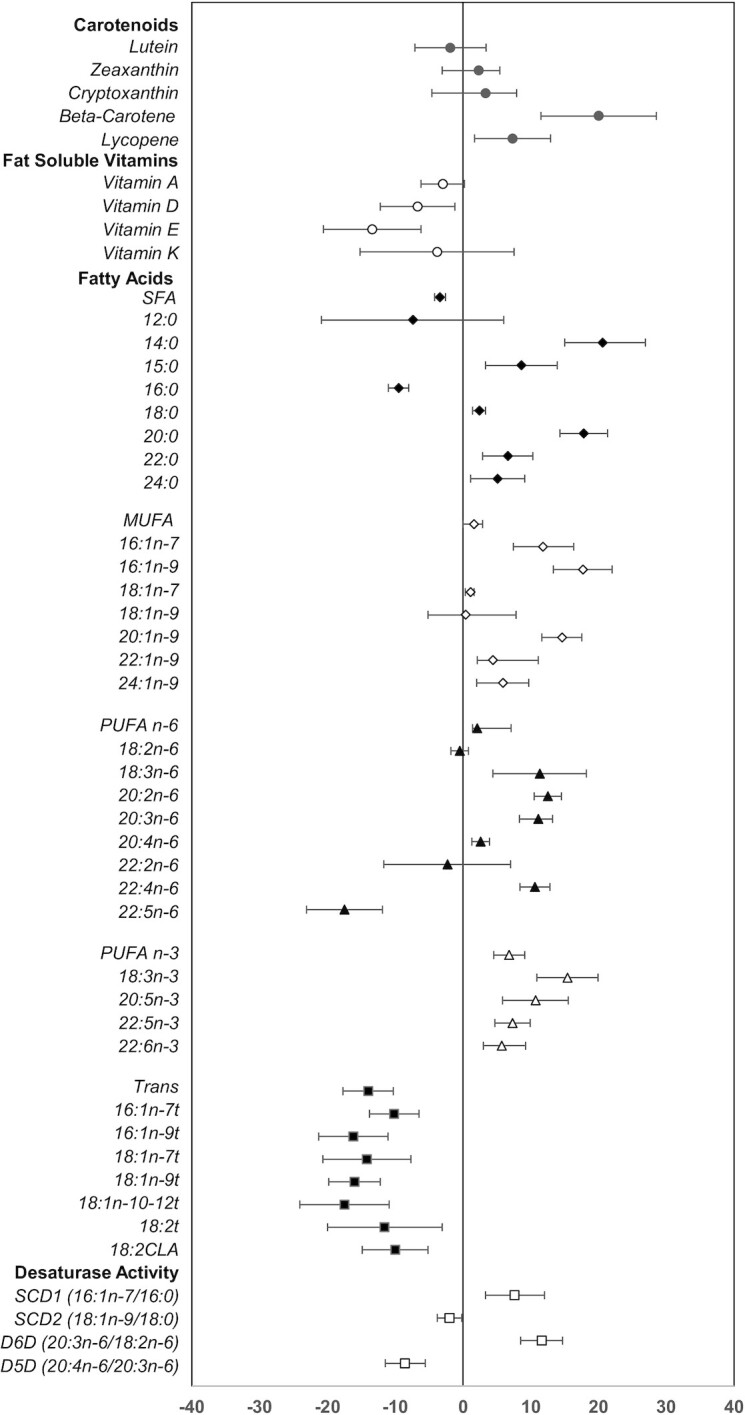
Pooled 1-y change in nutrient biomarker concentrations and desaturase enzyme activities. For each individual nutrient biomarker, the mean % difference is plotted as the symbol and the 95% CIs displayed as the bars. The mean % difference value and 95% CIs were derived from least-square means calculated from a mixed-effects random intercept model with time (baseline or 1-y) as a fixed effect and a random intercept for subject correlations. A separate model was fitted for each log-transformed outcome. n = 205 and included parents in the SC and SC + EP groups with both a baseline and 1-y nutrient biomarker value. CLA, conjugated linolenic acid; D5D, delta-5-desaturase; D6D, delta-6-desaturase; EP, enhanced program; SC, standard care; SCD, stearoyl Co-A desaturase.