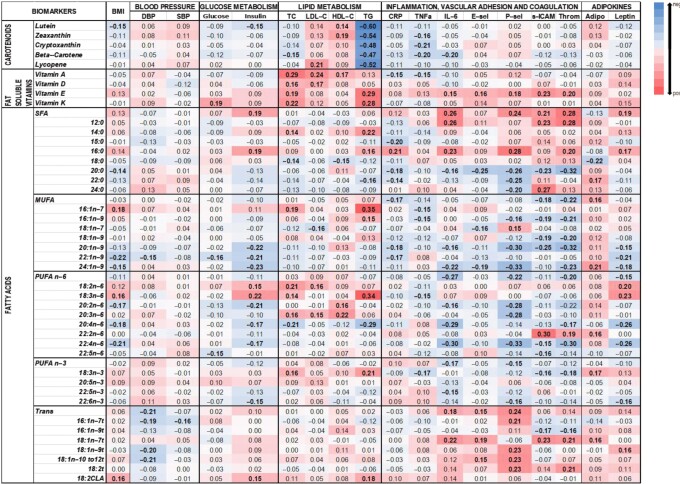
FIGURE 3.
Heatmap of the correlation between nutrient biomarkers, desaturase enzyme activities, and CMRFs. The correlation between 1-y change in CMRFs with 1-y change in nutrient biomarkers for each outcome pair was estimated using Spearman ρ correlation, adjusted for sex, age, group, and baseline CMRFs (and additionally adjusted for baseline BMI for correlations not with BMI). Blue indicates a negative association, whereas redindicates a positive association, with the darkness of each color corresponding to the magnitude of the “r” value, with significant values (P < 0.05) in bold. The number of parents included ranged from 193 to 205. Adipo, adiponectin; CLA, conjugated linolenic acid; CMRF, cardiometabolic risk factor; CRP, C-reactive protein; DBP, diastolic blood pressure; E-sel, E-selectin; HDL-C, HDL cholesterol; LDL-C, LDL cholesterol; P-sel, P-selectin; SBP, systolic blood pressure; sICAM, soluble intercellular adhesion molecule; TC, total cholesterol; TG, triglyceride; Throm, thrombomodulin.

