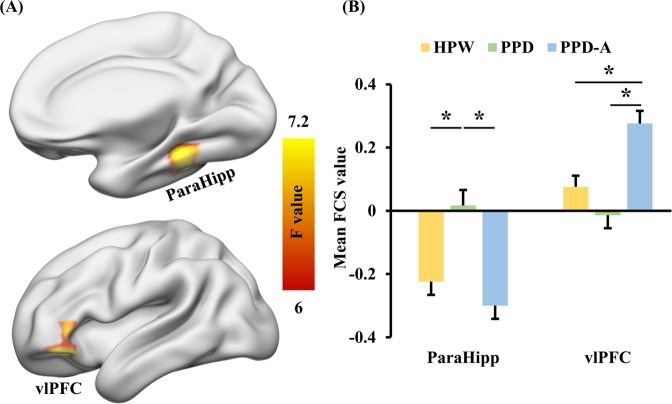
Fig. 1. Functional Connectivity Strength (FCS) differences among HPW, PPD, and PPD-A.
A One-way analysis of variance (ANOVA) of functional connectivity strength (FCS) maps revealed significant differences in right parahippocampus (ParaHipp) and left ventrolateral prefrontal cortex (vlPFC) between postpartum depression (PPD) and PPD with anxiety (PPD-A) and healthy postnatal women (HPW). B Post-hoc two-sample t tests showed that FCS in ParaHipp was higher in PPD patients compared to PPD-A patients and HPW, and FCS was higher in vlPFC in PPD-A patients compared to both PPD patients and HPW.

