FIG 3.
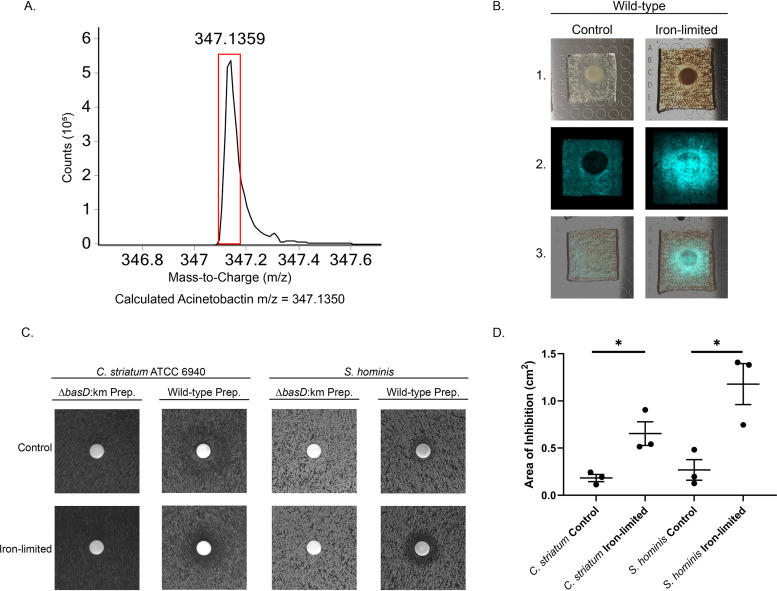
Biochemical evidence for acinetobactin-mediated inhibition. (A) Accurate mass spectra of the monoisotopic peak for acinetobactin preps purified from wild-type A. baumannii ATCC 17978. The red box represents where the peak is expected to be for acinetobactin. The theoretical m/z of monoisotopic acinetobactin is 347.1350, error 2.5 ppm and the observed m/z was 347.1359. (B) MALDI-IMS of acinetobactin production. 1. Images of wild-type 17978 spotted on a lawn of S. epidermidis 12228 on medium with (iron-limited) or without (control) 2,2’-dypyridyl. 2. Mass spectrometry analysis of the presence of acinetobactin. Presence of acinetobactin is false colored blue. 3. Overlap of 1 and 2. Experiments were repeated in triplicate and a representative image is shown. (C) HPLC prepped acinetobactin was added to a filter disk on a lawn of C. striatum or S. hominis on either 200 μM or 0 μM 2,2’-dypyridyl. A zone of inhibition indicates growth inhibition. Experiments were replicated and a representative image is shown. HPLC preps from a basD:km mutant was used as the control for inhibitory activity. (D) Quantification of the zones of inhibition for wild-type preps in C. The mean and standard error of the mean is shown in addition to the individual measurements. Significance was tested using a paired T-test comparing the control and iron-limited samples for each bacterial species. (⁕⁕, P ≤ 0.05).

