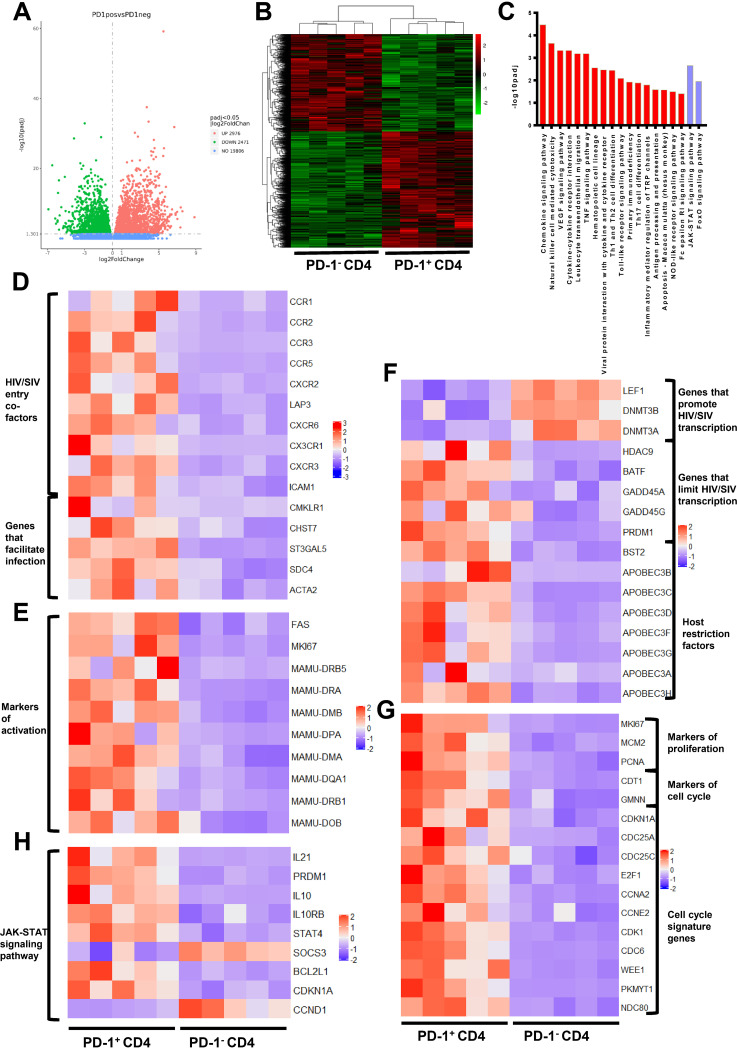
FIG 4.
Transcriptional profiling of PD-1+CD4+ T cells is beneficial for determining the latent status of HIV/SIV infection. (A) Volcano plot displaying genes detected by RNA-seq. Green dots represent the downregulated genes, and red dots indicate the upregulated genes in PD-1+CD4+ T cells. Green and red dots represent genes with a false discovery rate (FDR)-adjusted P < 0.05 and log2 change (FC) > 0; blue dots indicate genes with a FDR adjusted P > 0.05. (B) Hierarchical clustering and heatmap of the differentially expressed genes (DEGs) between PD-1+CD4+ and PD-1−CD4+ T cells. The displayed DEGs had |log2 FC| ≥0-fold changes in gene expression intensity and a FDR adjusted P value < 0.05 relative to the control cohort. (C) Top enriched immune and transcription-related pathways based on KEGG pathway analysis. Red bars indicate the enriched pathways in PD-1+CD4+ cells, and the purple bars represent the enriched pathways in PD-1−CD4+ cells. (D to G) Heatmap of the functional annotations of DEGs between PD-1+CD4+ and PD-1−CD4+ T cells. (H) Heatmap of DEGs in the JAK-STAT signaling pathway between PD-1+CD4+ and PD-1−CD4+ T cells.

